Fig. B.3
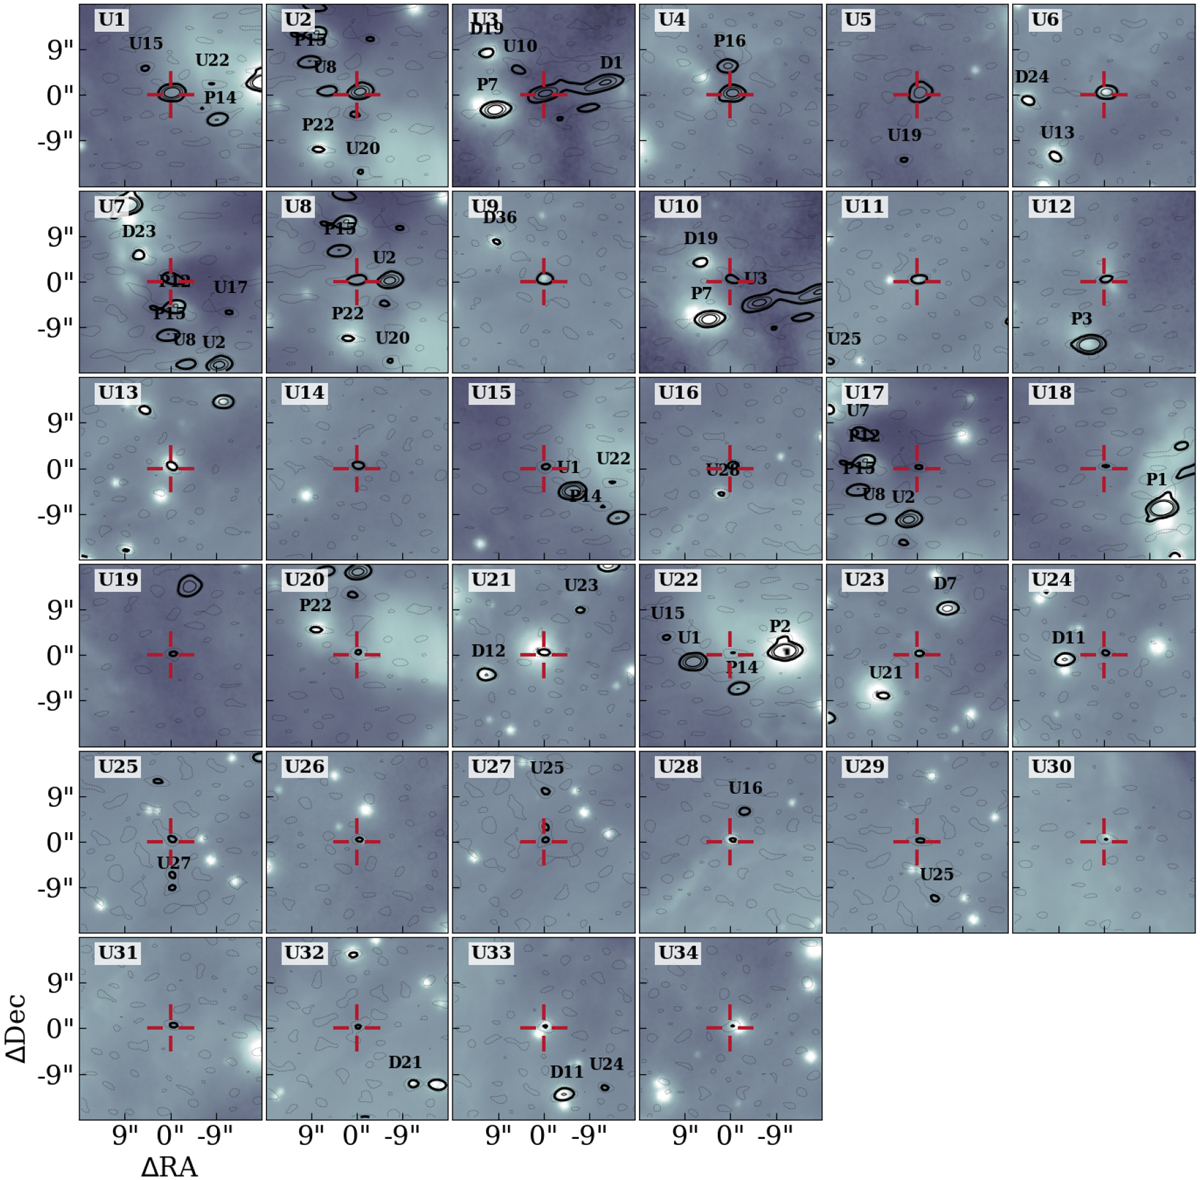
All point sources detected by ALMA (this study), but missing Spitzer counterparts (Megeath et al. 2012), ordered by millimeter flux. Solid contours show the 3, 6, 12, and 24σ noise levels of the ALMA observations; dashed contours show the 1σ flux. The background is the VISTA Ks image from Meingast et al. (2016). Small labels indicate the types of nearby objects in this survey.
Current usage metrics show cumulative count of Article Views (full-text article views including HTML views, PDF and ePub downloads, according to the available data) and Abstracts Views on Vision4Press platform.
Data correspond to usage on the plateform after 2015. The current usage metrics is available 48-96 hours after online publication and is updated daily on week days.
Initial download of the metrics may take a while.