Fig. 3
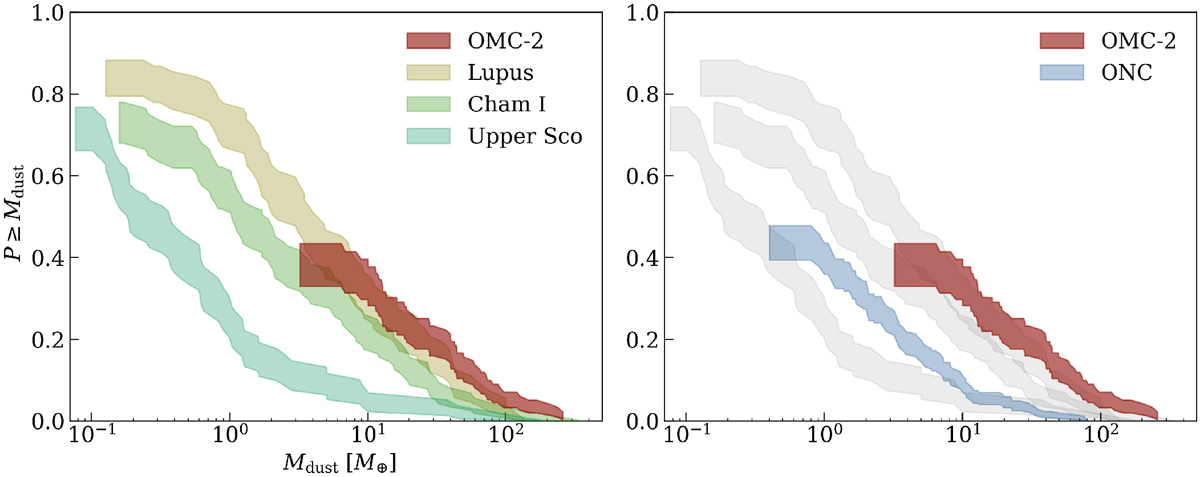
Inferred disk mass distribution in OMC-2 (red) compared to the disk mass distribution in low-mass star-forming regions (left) and to disks in the inner 1.5′ × 1.5′ of the ONC (blue, right). Data for the low-mass regions comes from Ansdell et al. (2016) for Lupus, Pascucci et al. (2016) for Cham I, and Barenfeld et al. (2016) for Upper Sco; only Class II objects with known stellar masses are included. For the ONC, disk masses come from Eisner et al. (2018). The three low-mass regions are reproduced as gray silhouettes in the right panel to facilitate the comparison.
Current usage metrics show cumulative count of Article Views (full-text article views including HTML views, PDF and ePub downloads, according to the available data) and Abstracts Views on Vision4Press platform.
Data correspond to usage on the plateform after 2015. The current usage metrics is available 48-96 hours after online publication and is updated daily on week days.
Initial download of the metrics may take a while.