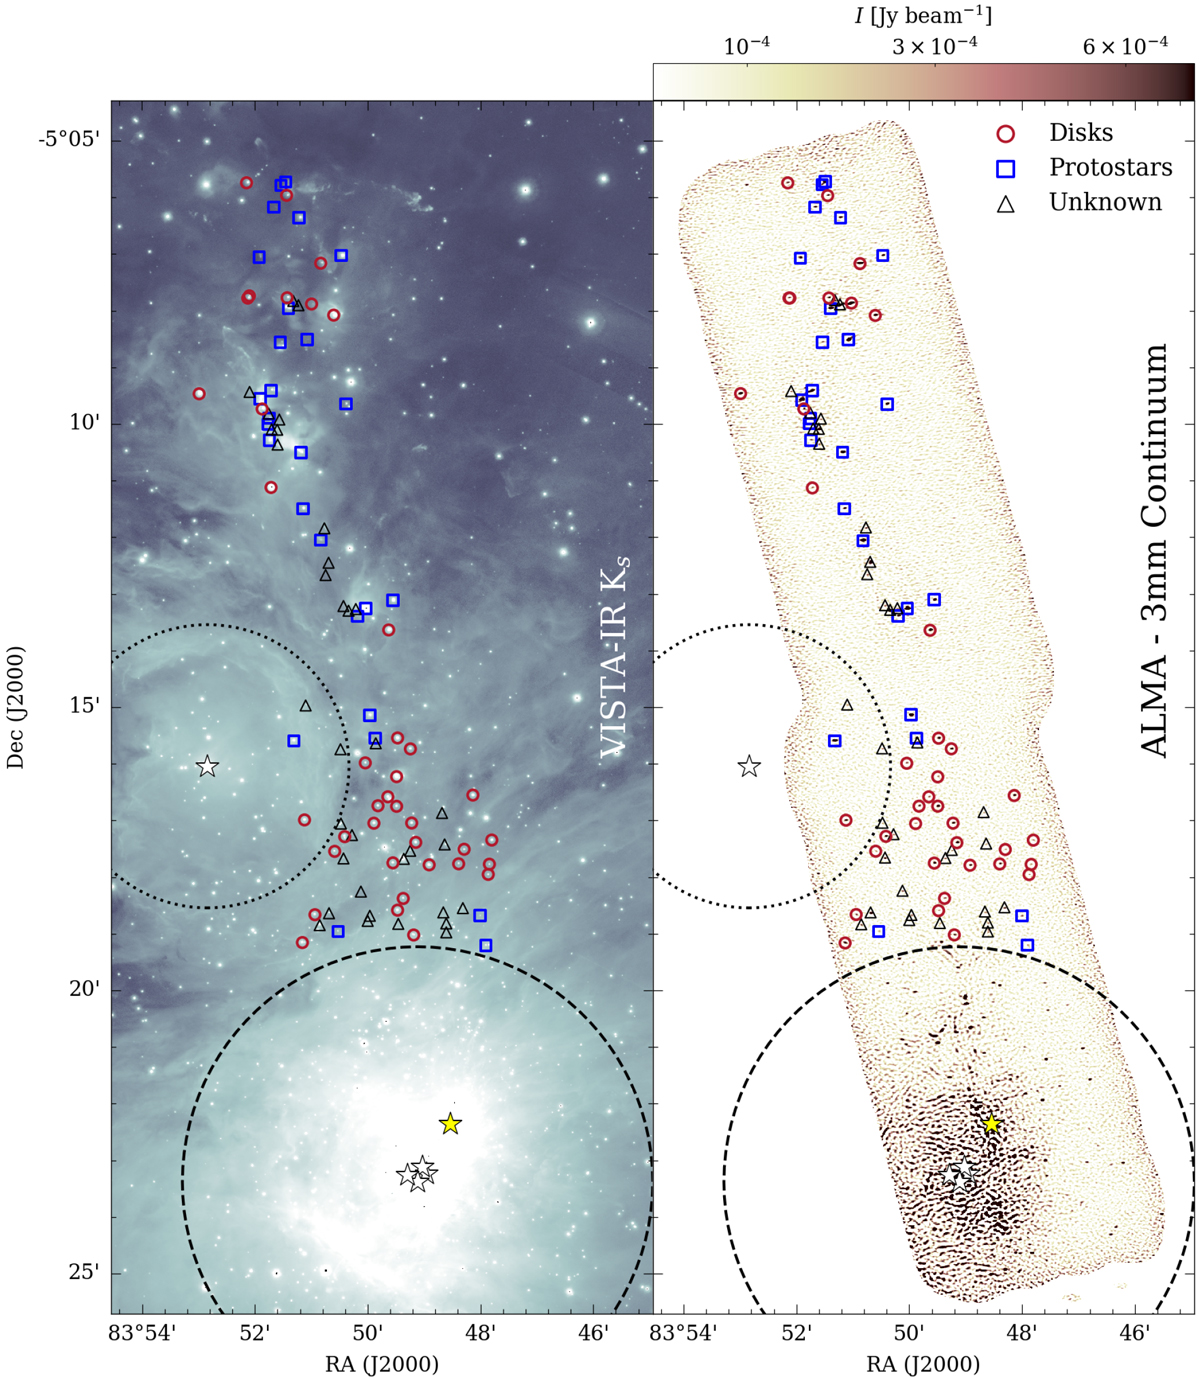
Fig. 1

Spatially filtered ALMA observations of the OMC-2 region at 3 mm (right) and VISTA Ks observationsof the same area (left) (Meingast et al. 2016). Point sources detected in the ALMA data are shown: disks and protostars from the Megeath et al. (2012) catalog (red circles and blue squares, respectively); sources without detected counterparts in this catalog (black triangles). White stars indicate the locations of the Trapezium stars θ1 Ori A – D and HD 37061; the dashed black line indicates the photoionization region around the Trapezium out to 0.5 pc, while M 42 is marked by the dotted circle. The Orion KL outflow is shown by the yellow star.
Current usage metrics show cumulative count of Article Views (full-text article views including HTML views, PDF and ePub downloads, according to the available data) and Abstracts Views on Vision4Press platform.
Data correspond to usage on the plateform after 2015. The current usage metrics is available 48-96 hours after online publication and is updated daily on week days.
Initial download of the metrics may take a while.


