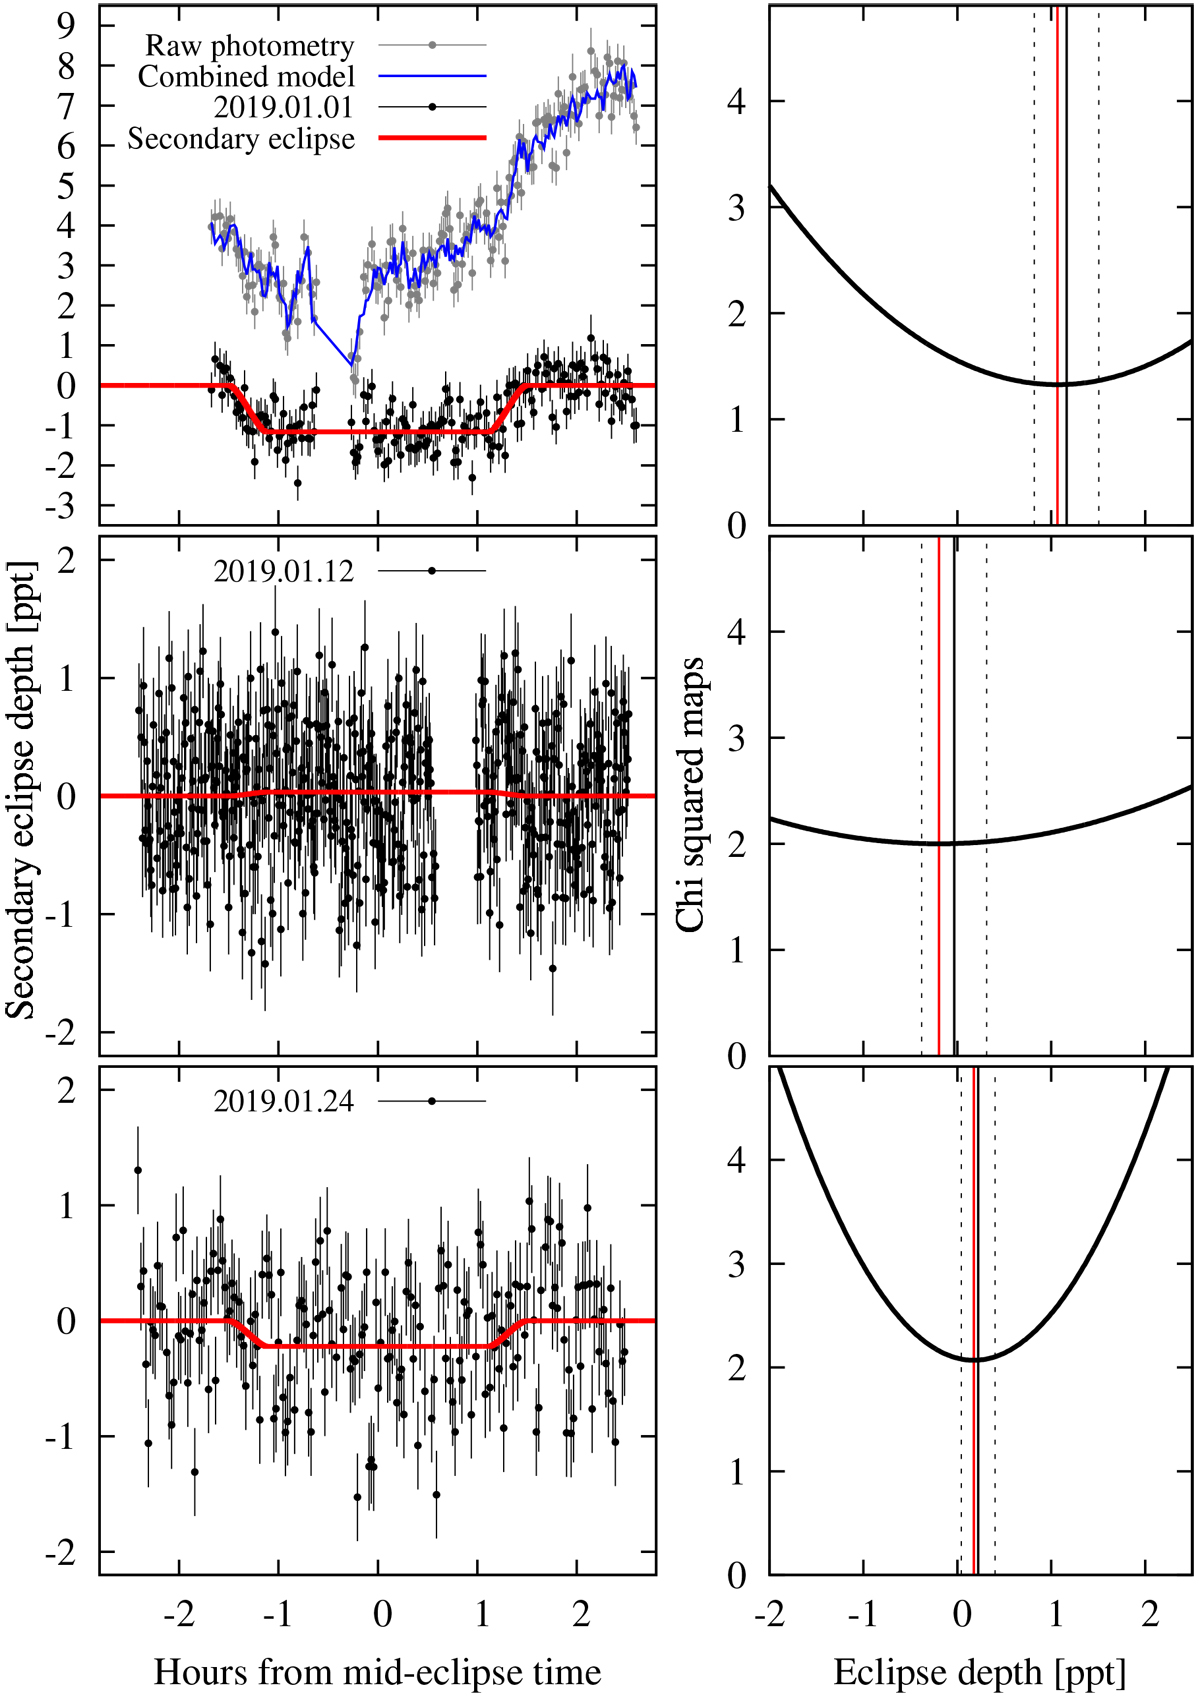
Fig. 9

Left: secondary eclipse data of WASP-12b obtained with the NOT and the EDs turned on. Black circles and error bars correspond to the photometric data. The red continuous line shows the best-fit secondary eclipse, in ppt. For the most prominent eclipse we show raw photometry (gray squares), along with the combined best-fit model (transit times detrending) (blue solid line). Right: χ2 maps for different scaling factors. The thick black line corresponds to the χ2 values obtained for different eclipse depths. The red vertical line indicates the minimization of χ2, and the black solid vertical line, along with the two dashed lines, indicate the best-fit MCMC results and a ±2σ contour.
Current usage metrics show cumulative count of Article Views (full-text article views including HTML views, PDF and ePub downloads, according to the available data) and Abstracts Views on Vision4Press platform.
Data correspond to usage on the plateform after 2015. The current usage metrics is available 48-96 hours after online publication and is updated daily on week days.
Initial download of the metrics may take a while.


