Fig. 6
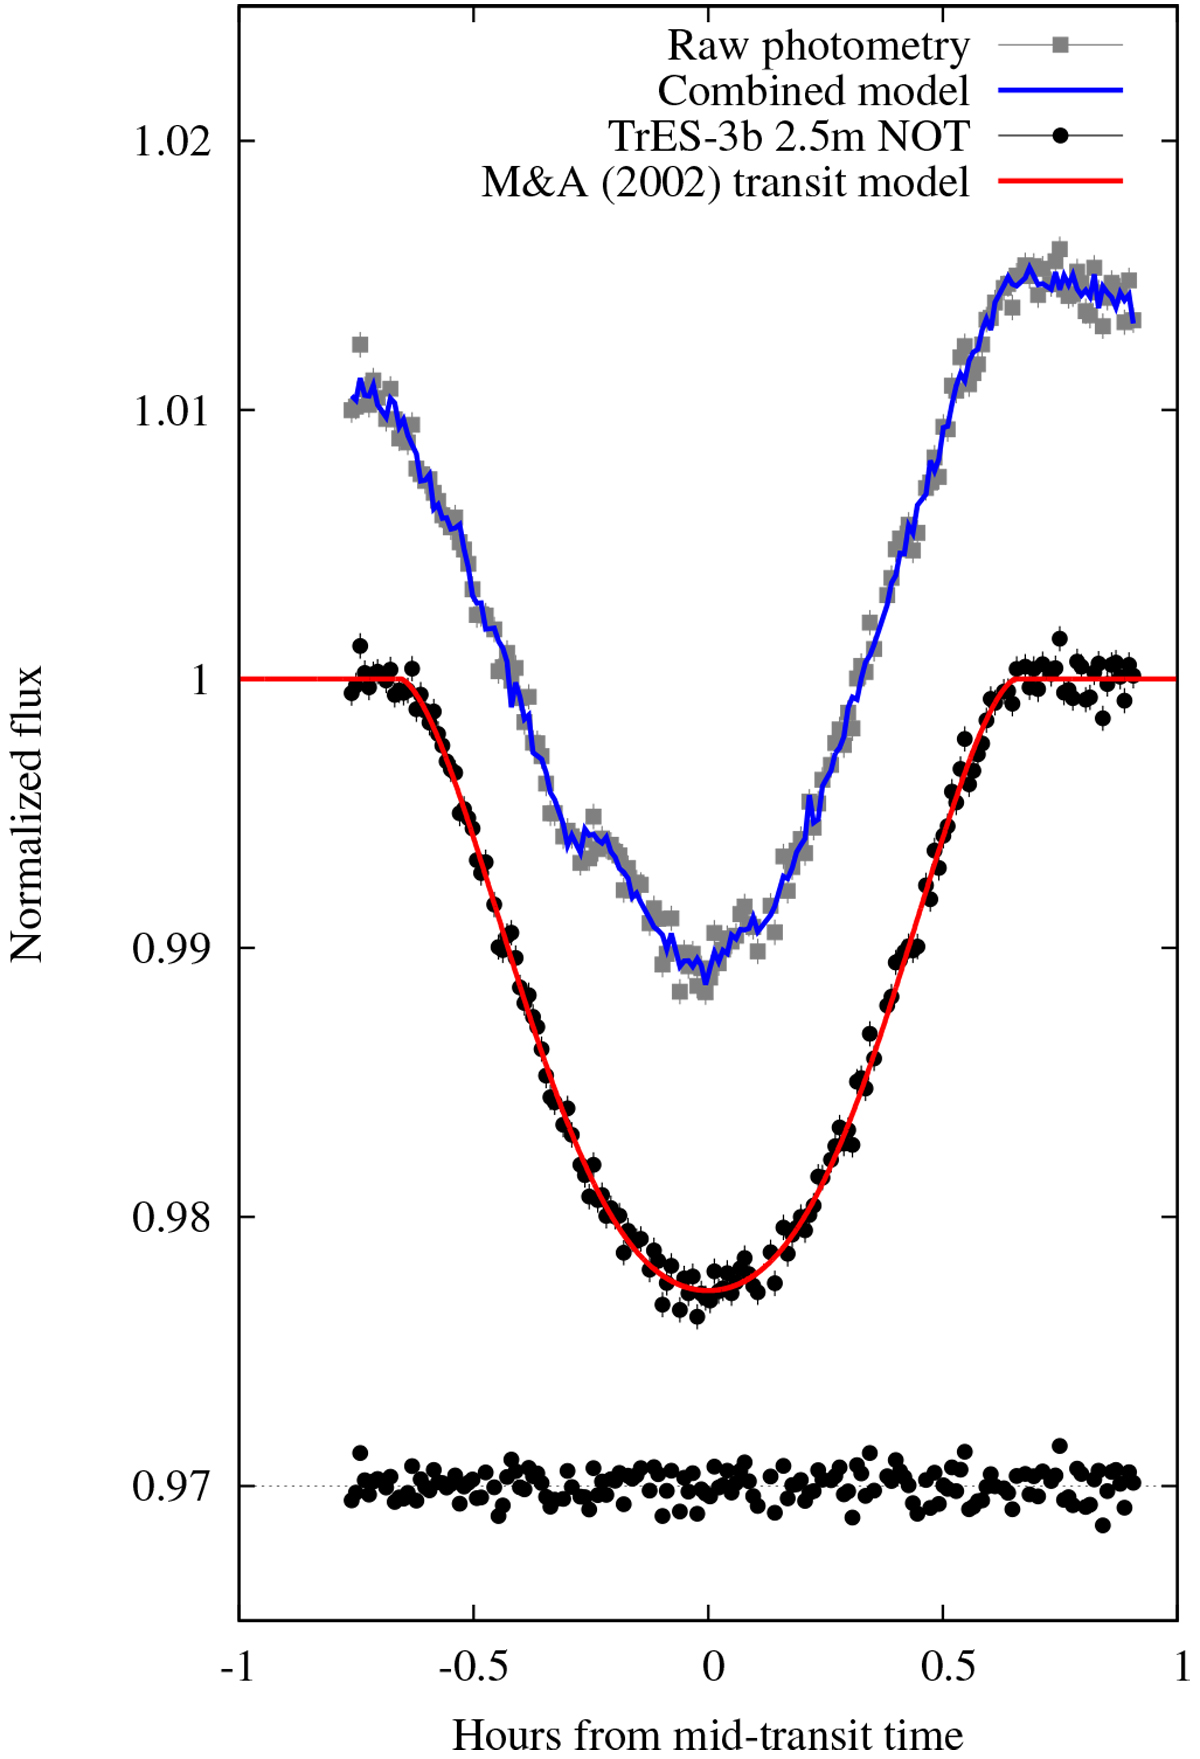
Primary transit photometry for TrES-3b as a function of the hours from the best-fit mid-transit time. From top to bottom: raw photometry (gray squares) along with the combined best-fit model (transit times detrending) (blue solid line). Black circles and error bars correspond to the detrended photometry, and the red continuous line to the best-fit transit model. Residuals are shown below. All quantities are artificially shifted to allow for visual inspection.
Current usage metrics show cumulative count of Article Views (full-text article views including HTML views, PDF and ePub downloads, according to the available data) and Abstracts Views on Vision4Press platform.
Data correspond to usage on the plateform after 2015. The current usage metrics is available 48-96 hours after online publication and is updated daily on week days.
Initial download of the metrics may take a while.