Free Access
Fig. 2
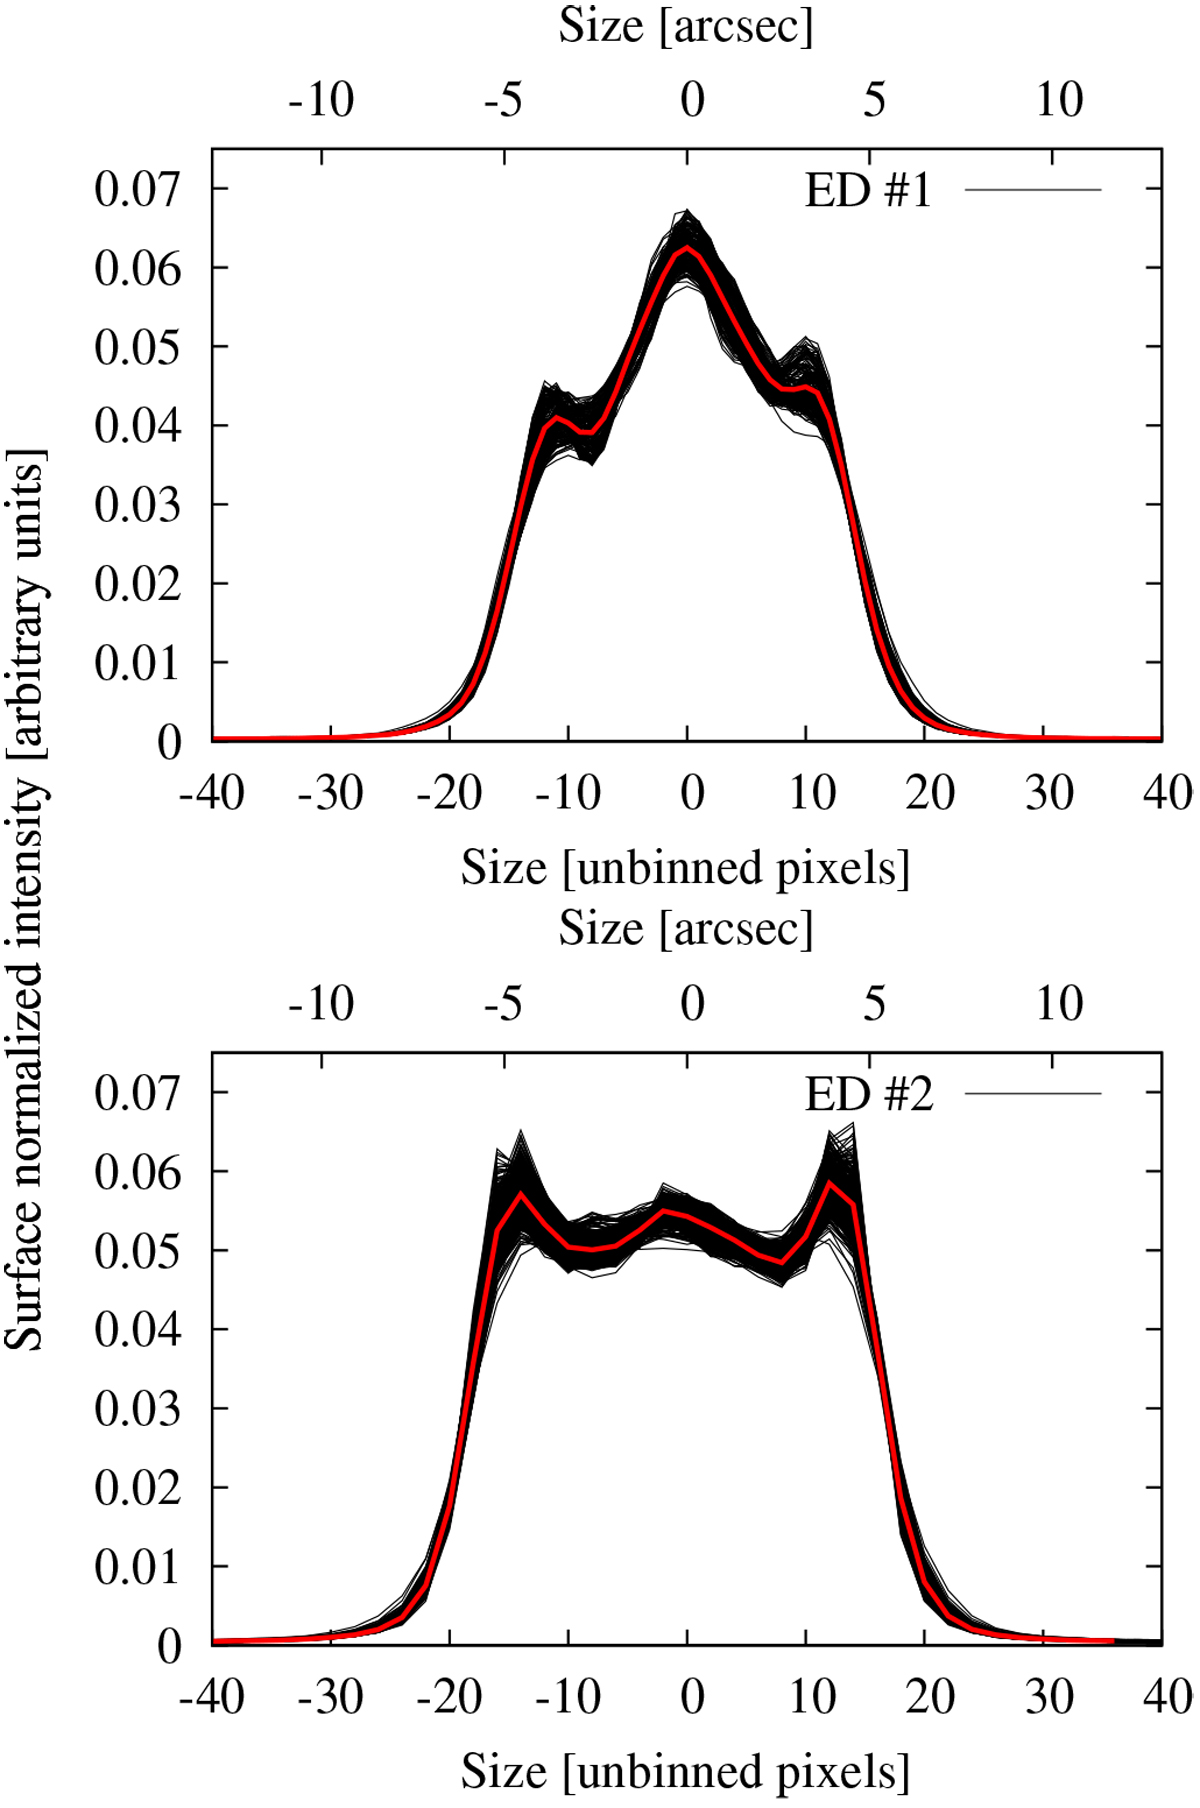
Diffusing pattern of the EDs as a function of unbinned pixels (bottom axis) and arcseconds (top axis). The diffused PSF profiles from ED #1 and ED #2 are shown in theupper and lower panels, respectively. The red line shows the intra-night averaged PSF profile.
Current usage metrics show cumulative count of Article Views (full-text article views including HTML views, PDF and ePub downloads, according to the available data) and Abstracts Views on Vision4Press platform.
Data correspond to usage on the plateform after 2015. The current usage metrics is available 48-96 hours after online publication and is updated daily on week days.
Initial download of the metrics may take a while.