Fig. 9.
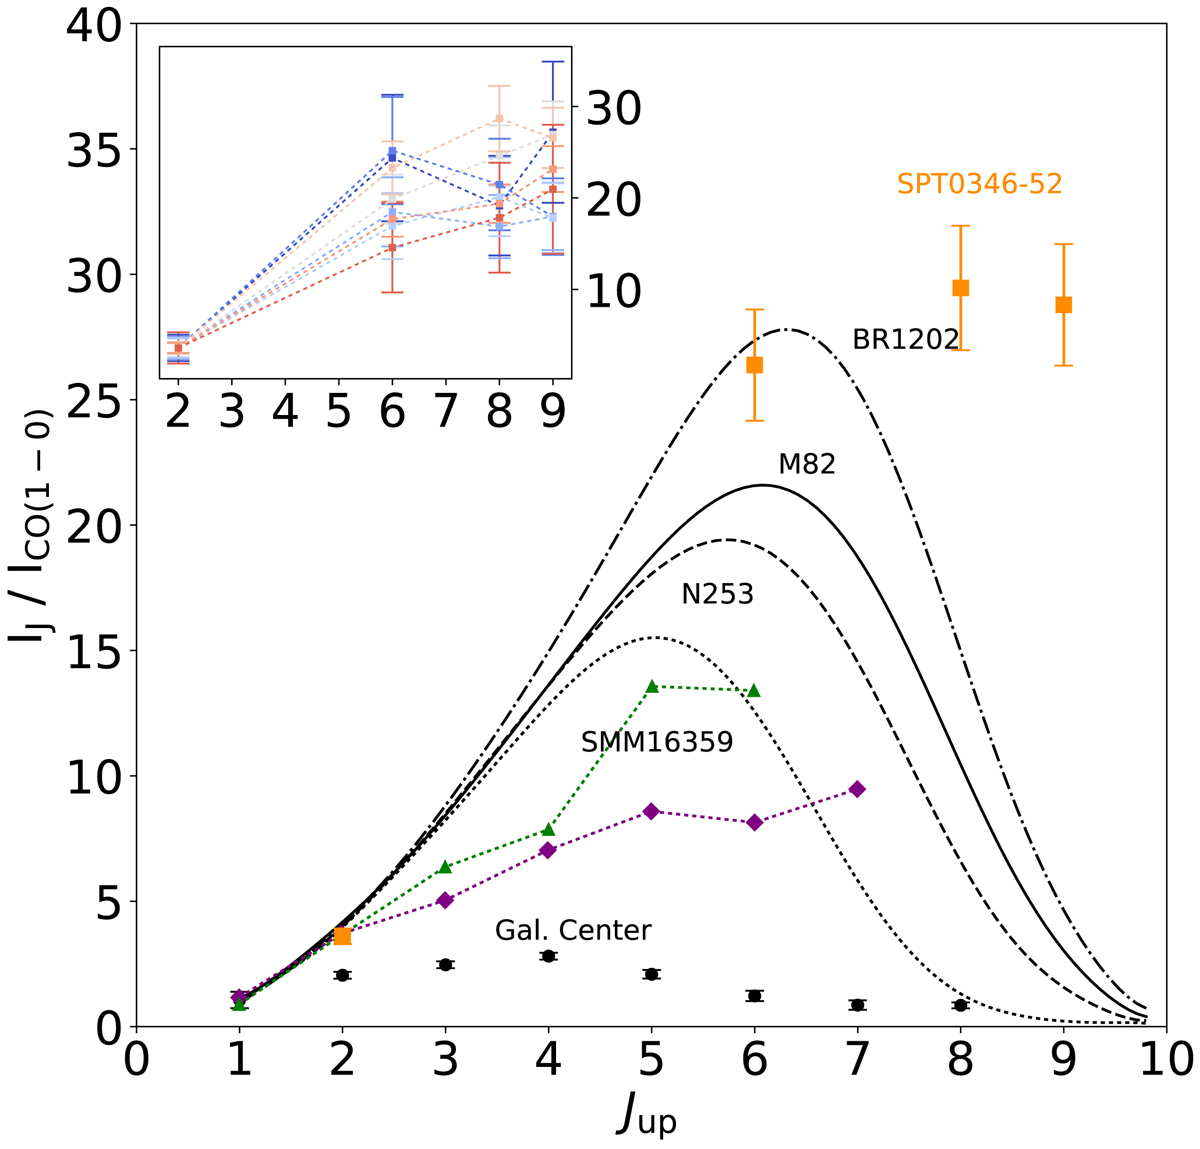
Comparison of the CO SLEDs normalized to the CO(1 − 0) flux density transition with different galaxies. Orange squares represent the obtained CO SLED of SPT 0356-52 taking the line flux described in Table 4. Black lines shows BR 1202−0725 (z = 4.69, (Carilli et al. 2002; Riechers et al. 2006), M 82 Center (Weiß et al. 2005b), NGC 253 Center (Güsten et al. 2006), SMM 16359 (z = 2.5, Weiß et al. (2005a)). The solid circles shows the Galactic center (Fixsen et al. 1999), diamonds shows average SLED of DSFGs (Bothwell et al. 2013), and triangles shows SLED of SPT DSFGs (Spilker et al. 2014). The inset shows the CO SLED normalized to the CO(1 − 0) for different velocities in SPT 0356-52.
Current usage metrics show cumulative count of Article Views (full-text article views including HTML views, PDF and ePub downloads, according to the available data) and Abstracts Views on Vision4Press platform.
Data correspond to usage on the plateform after 2015. The current usage metrics is available 48-96 hours after online publication and is updated daily on week days.
Initial download of the metrics may take a while.