Free Access
Fig. 8.
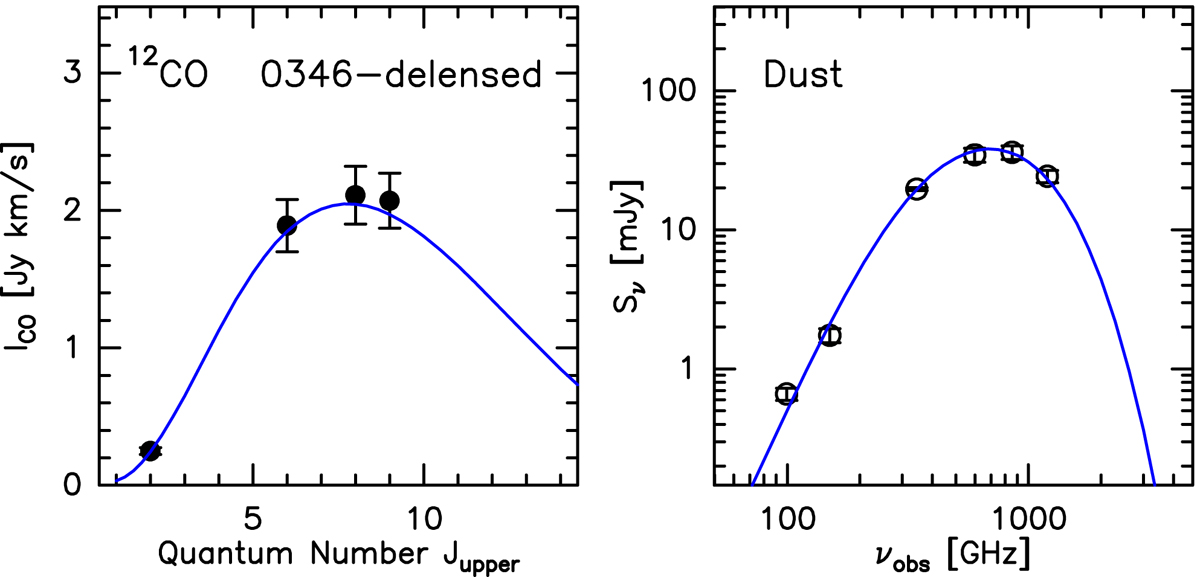
Result of the fitting of the CO-SLED (left panel) and SED (right panel). The filled circles are the CO rotational lines and the open circles represent the continuum fluxes obtained in this work and from Spilker et al. (2016) and Ma et al. (2016). The blue line in both panels shows the best-fit model.
Current usage metrics show cumulative count of Article Views (full-text article views including HTML views, PDF and ePub downloads, according to the available data) and Abstracts Views on Vision4Press platform.
Data correspond to usage on the plateform after 2015. The current usage metrics is available 48-96 hours after online publication and is updated daily on week days.
Initial download of the metrics may take a while.