Fig. 7.
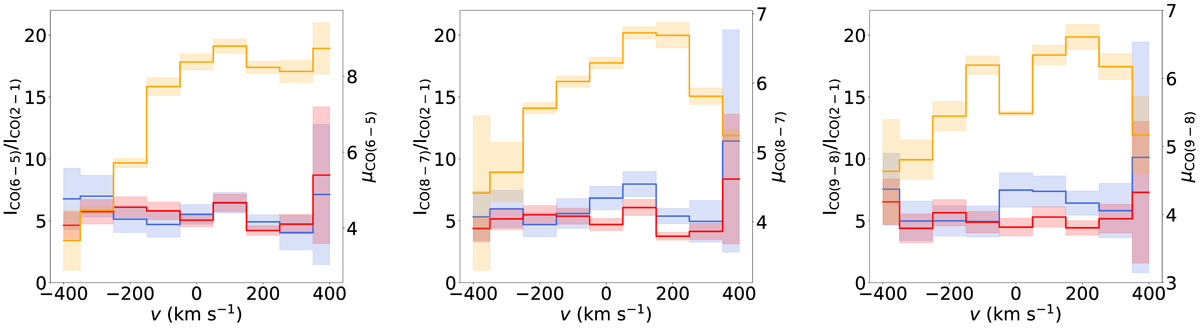
CO ratio of intrinsic (blue line) and observed emission line intensities (red line) across the line profile for CO(6 − 5)/CO(2 − 1) (left panel), CO(8 − 7)/CO(2 − 1) (middle panel), and CO(9 − 8)/CO(2 − 1) (right panel). The orange line represent the magnification factor across the line profile for CO(6 − 5), CO(8 − 7) (middle panel), and CO(9 − 8) (right panel).
Current usage metrics show cumulative count of Article Views (full-text article views including HTML views, PDF and ePub downloads, according to the available data) and Abstracts Views on Vision4Press platform.
Data correspond to usage on the plateform after 2015. The current usage metrics is available 48-96 hours after online publication and is updated daily on week days.
Initial download of the metrics may take a while.