Fig. 6.
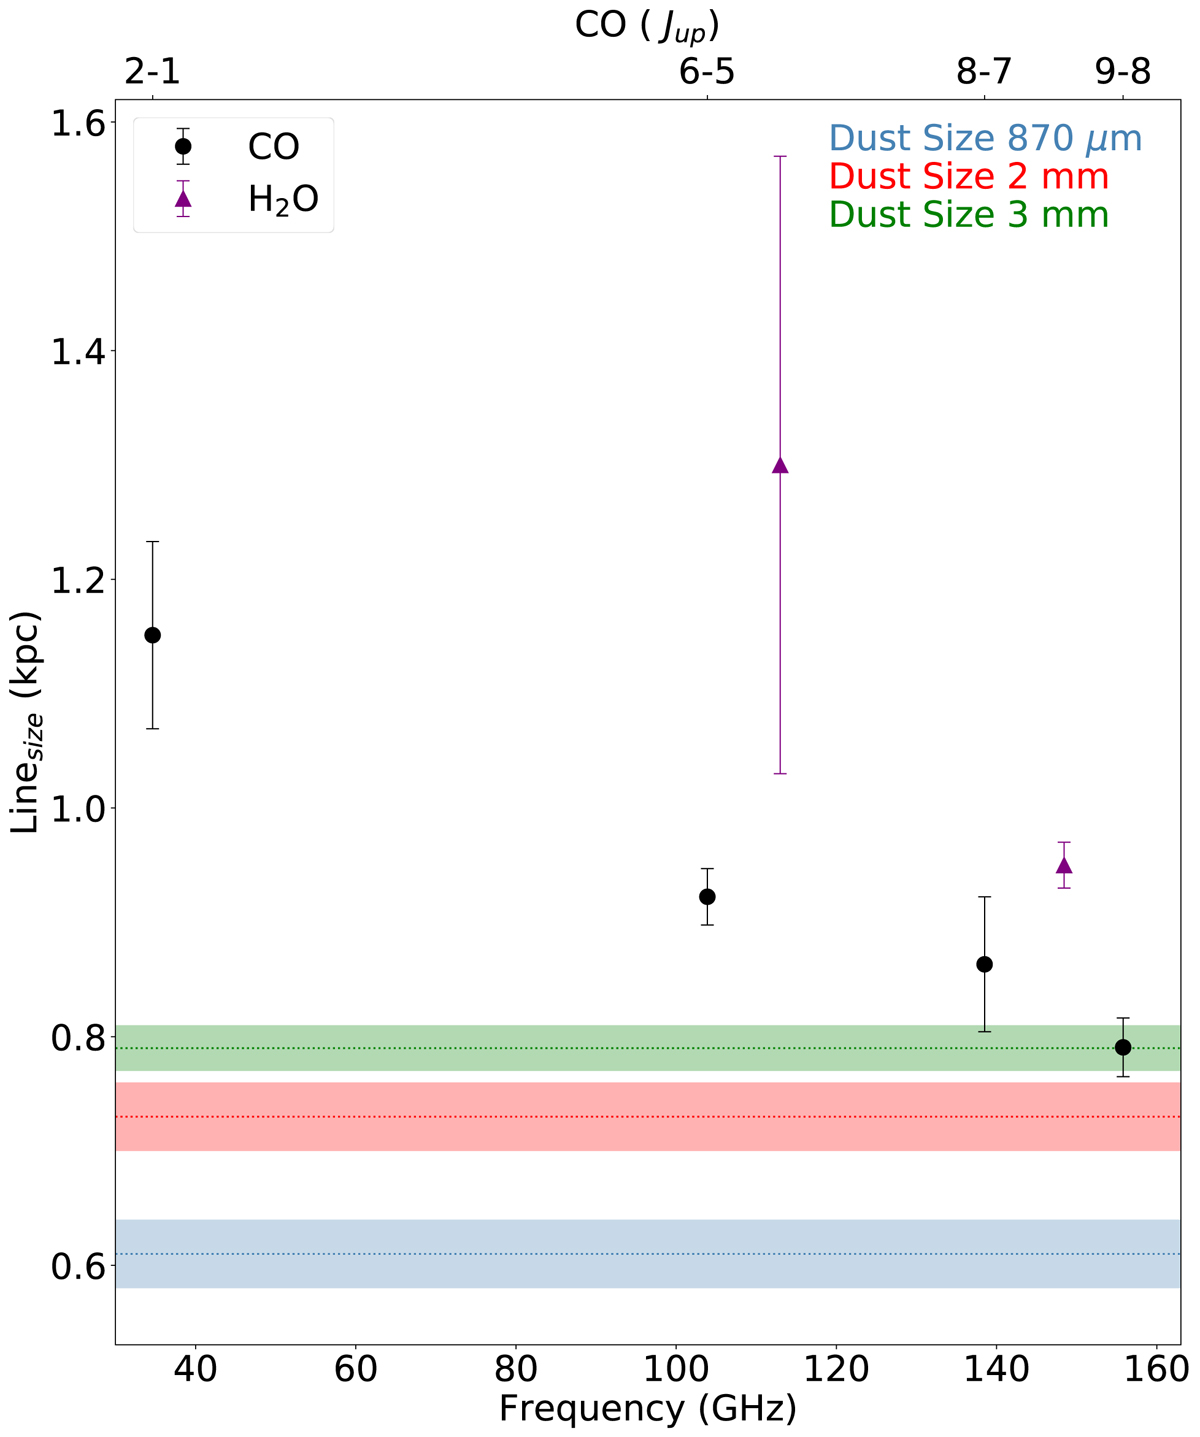
Dependency of the reconstructed source size (half-light radius) of the line emission regions with transition or frequency. Black dots show reconstructed CO line emission regions as a function of the J transition and the observed frequency. Purple triangles show reconstructed H2O line emission as a function of the observed frequency. The dotted lines represent the size (r1/2) of the dust for different wavelengths, blue for 870 μm, red for 2 mm, and green for 3 mm continuum emission.
Current usage metrics show cumulative count of Article Views (full-text article views including HTML views, PDF and ePub downloads, according to the available data) and Abstracts Views on Vision4Press platform.
Data correspond to usage on the plateform after 2015. The current usage metrics is available 48-96 hours after online publication and is updated daily on week days.
Initial download of the metrics may take a while.