Fig. 4.
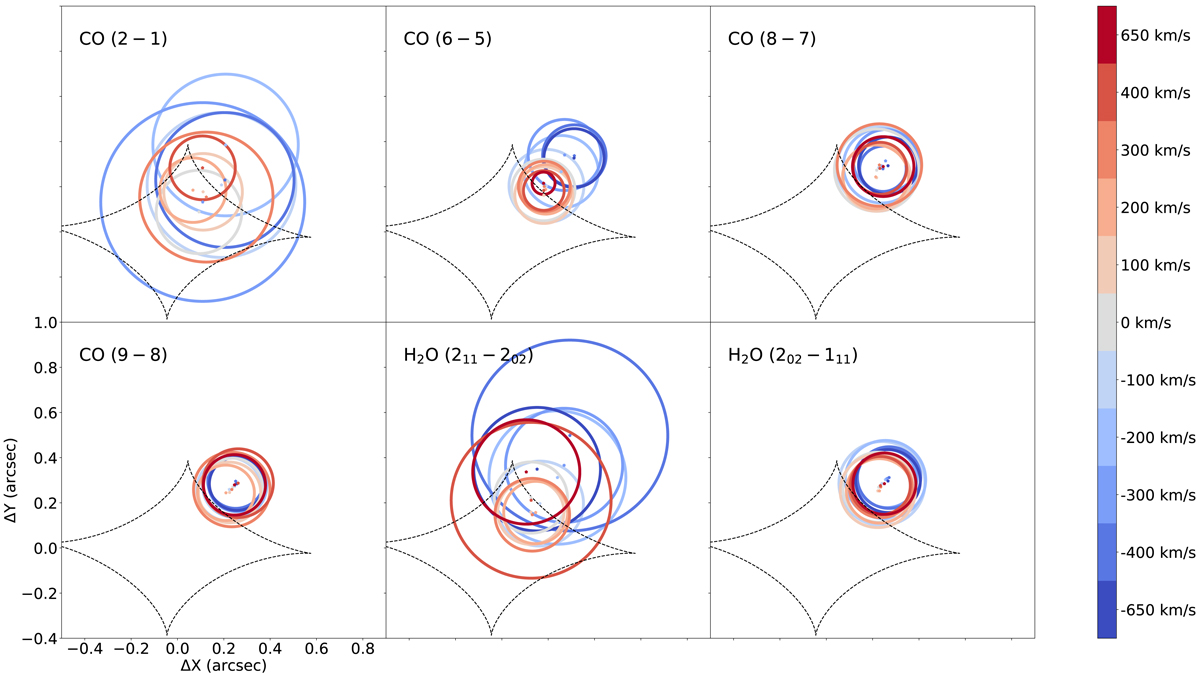
Reconstruction of the source plane in each velocity bin as described in the text. The velocity bins are color-coded, following the color bar to the right and as represented in Fig. 2. The circles represent the size of the reconstructed emission in each velocity bin, defined by the half-light radius (see text). The color-coded central dots show the reconstructed source position at the respective velocity bin. The dotted black line shows the lensing caustic curve from the lens model of Spilker et al. (2016).
Current usage metrics show cumulative count of Article Views (full-text article views including HTML views, PDF and ePub downloads, according to the available data) and Abstracts Views on Vision4Press platform.
Data correspond to usage on the plateform after 2015. The current usage metrics is available 48-96 hours after online publication and is updated daily on week days.
Initial download of the metrics may take a while.