Free Access
Fig. 3.
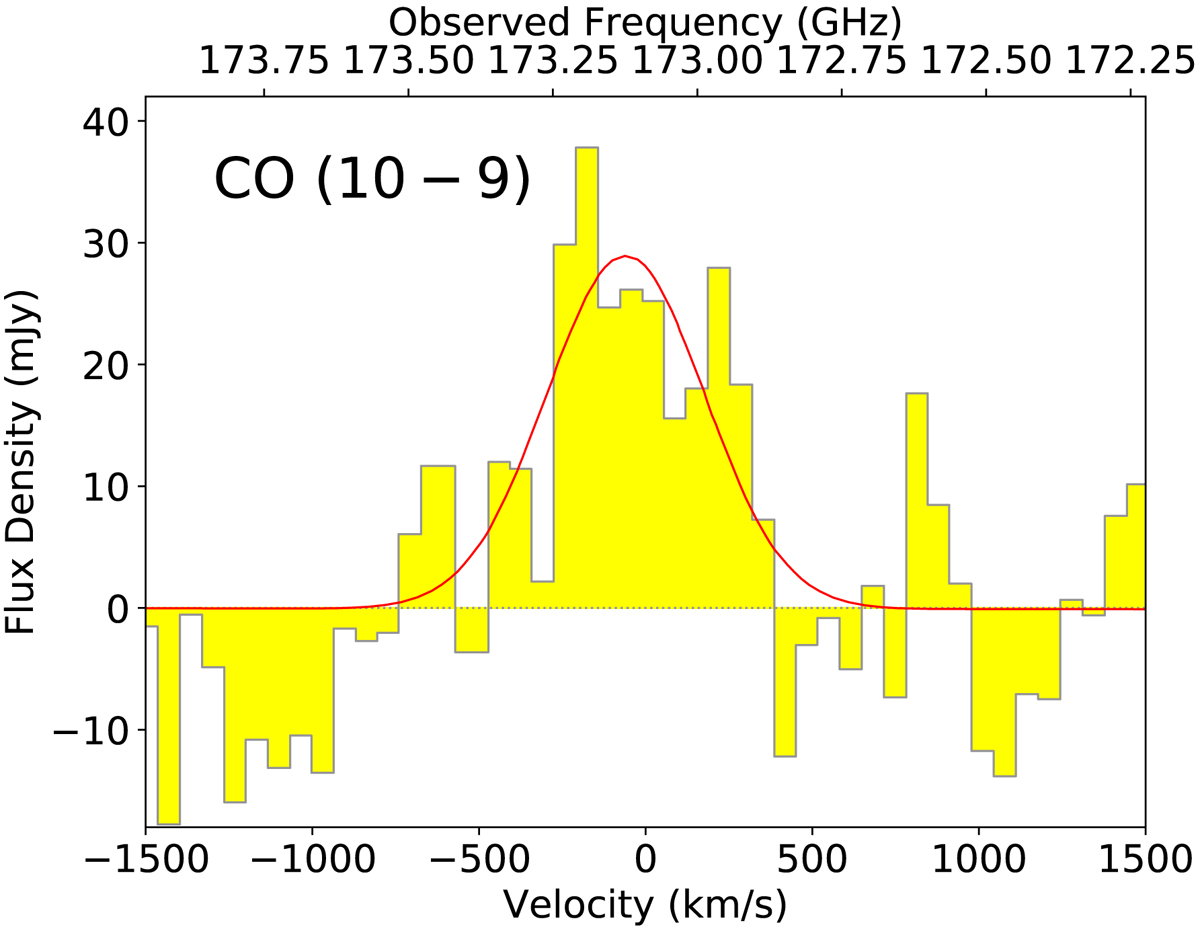
Spectrum of the CO(10 − 9) line emission observed with APEX of SPT 0346-52. The red solid curve shows a Gaussian fit to the line profile. This line is about two times stonger than that of CO(9−8), suggesting contamination by a neighboring emission line.
Current usage metrics show cumulative count of Article Views (full-text article views including HTML views, PDF and ePub downloads, according to the available data) and Abstracts Views on Vision4Press platform.
Data correspond to usage on the plateform after 2015. The current usage metrics is available 48-96 hours after online publication and is updated daily on week days.
Initial download of the metrics may take a while.