Fig. 2.
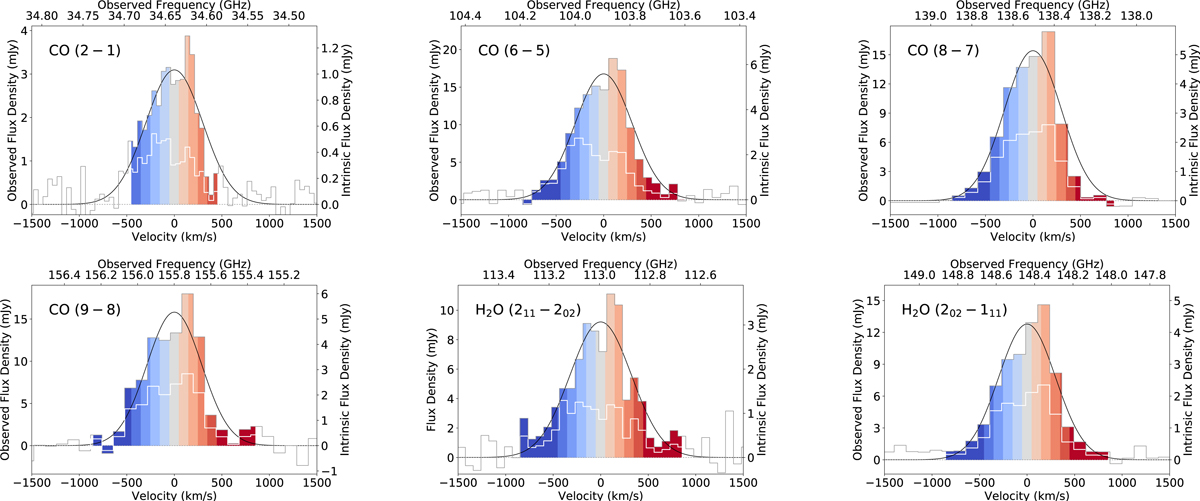
Spectra of the line transitions detected in SPT 0346-52 obtained with the ATCA and ALMA observations. Single Gaussian fits are represented by black lines, centered at the observed frequencies. The white line shows the intrinsic flux using the values of magnification described in Tables A.1 and A.2. The different channels used in the lens modeling are color-coded according to their velocity on whether the emission is receding (red) or approaching (blue). Each channel is 100 km s−1 wide, except for the edge channels which are 400 km s−1 to improve their low S/N.
Current usage metrics show cumulative count of Article Views (full-text article views including HTML views, PDF and ePub downloads, according to the available data) and Abstracts Views on Vision4Press platform.
Data correspond to usage on the plateform after 2015. The current usage metrics is available 48-96 hours after online publication and is updated daily on week days.
Initial download of the metrics may take a while.