Fig. 1.
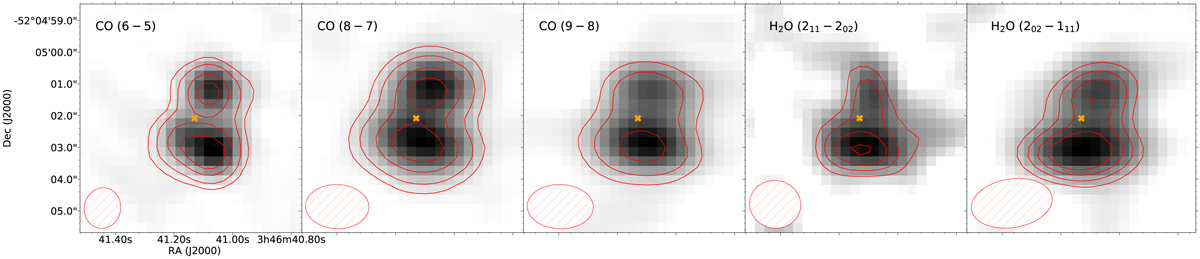
Maps of the line transitions detected in SPT 0346-52 obtained with ALMA observations, integrated over 4σvelocity km s−1 channels. For H2O 211 − 202 and H2O 202 − 111 red contours are the 2, 4, 6, 8σ intervals. For CO(6−5), CO(8−7), and CO(9−8) red contours are the 5, 10, 20, 30σ intervals. The synthesized beam is shown in the bottom left corner as a red ellipse. The orange cross shows the center of the lensing galaxy.
Current usage metrics show cumulative count of Article Views (full-text article views including HTML views, PDF and ePub downloads, according to the available data) and Abstracts Views on Vision4Press platform.
Data correspond to usage on the plateform after 2015. The current usage metrics is available 48-96 hours after online publication and is updated daily on week days.
Initial download of the metrics may take a while.