Free Access
Fig. 3.
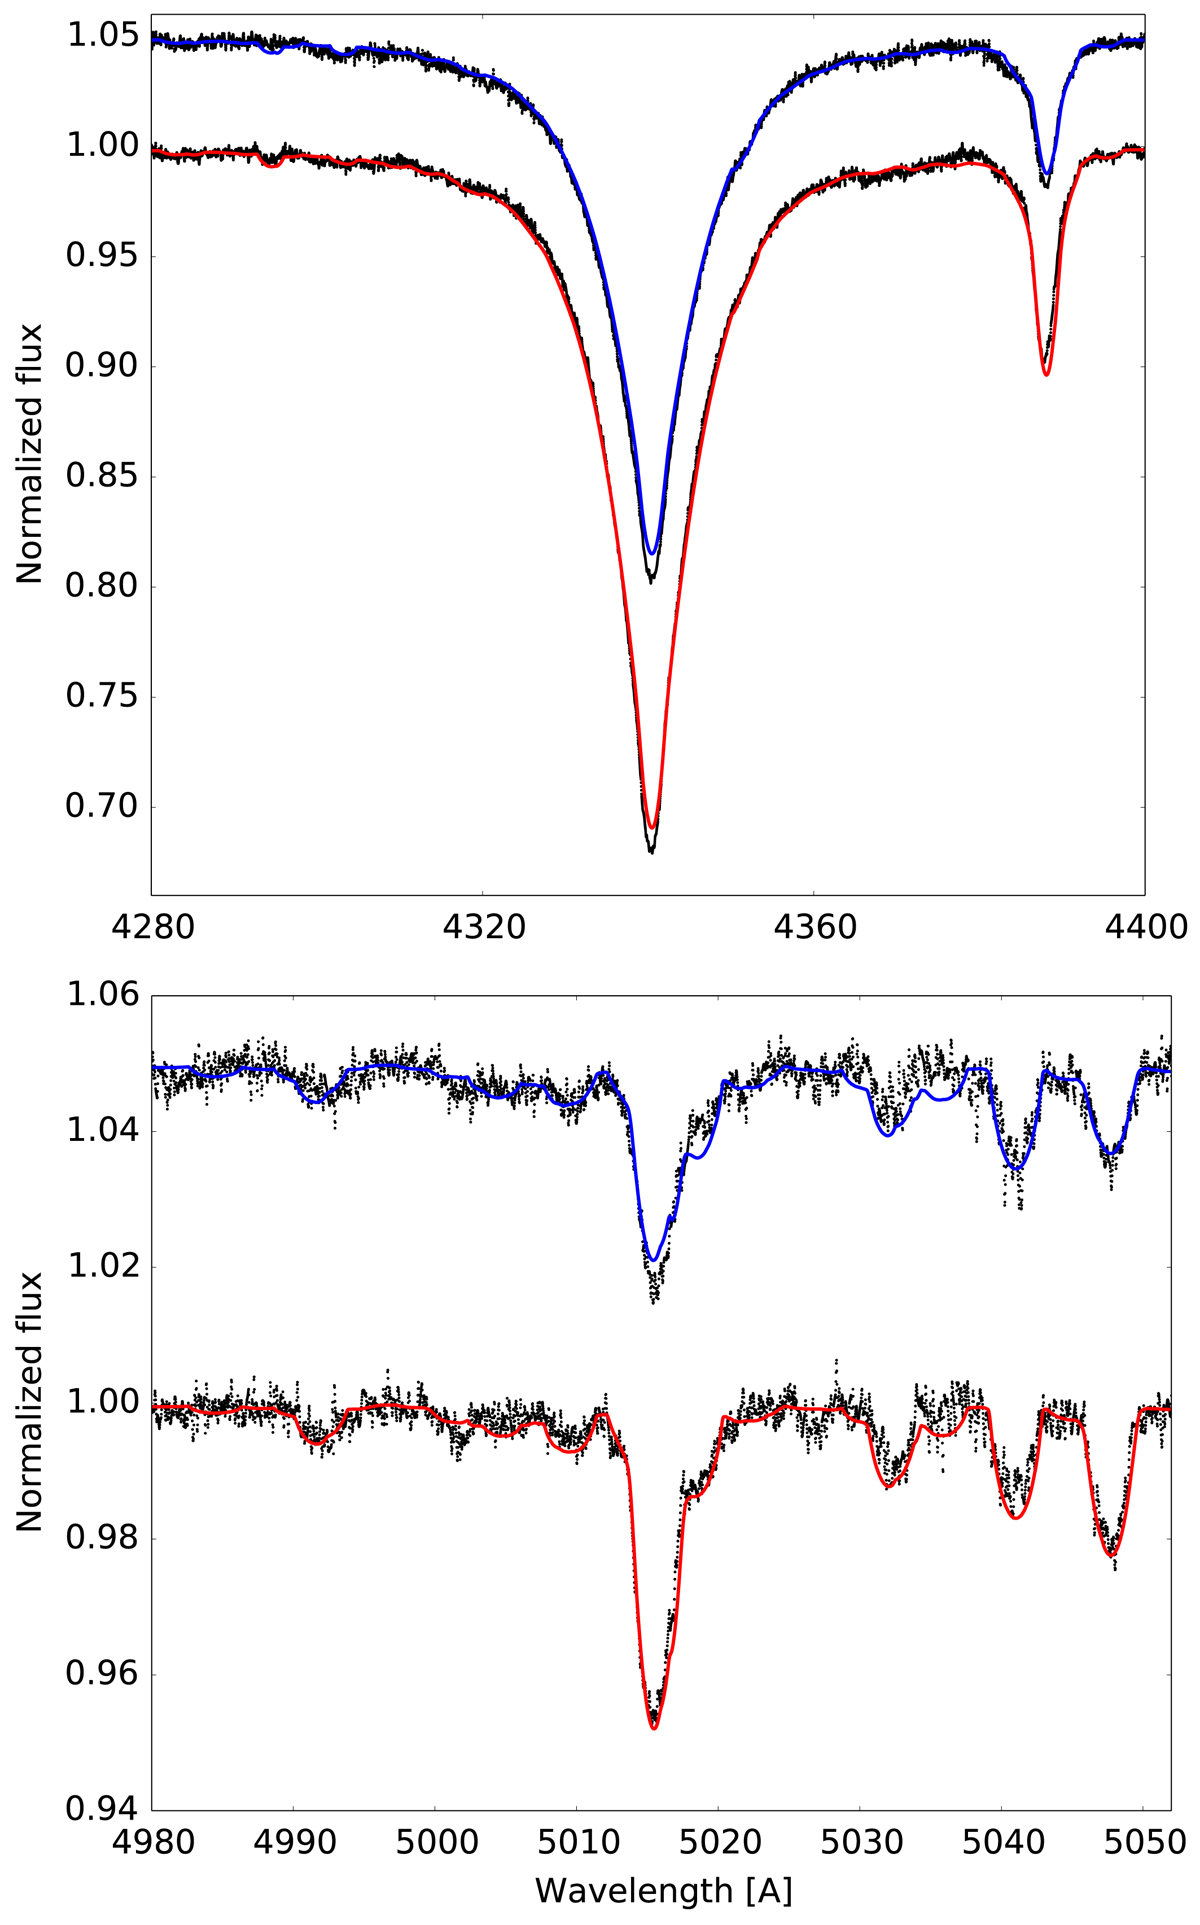
Quality of the fit of the disentangled spectra (black dots) with the synthetic spectra computed from the best fit parameters listed in Table 2 (red and blue solid line for the primary and secondary component, respectively). The spectra of the secondary component were vertically shifted by a constant factor for clarity.
Current usage metrics show cumulative count of Article Views (full-text article views including HTML views, PDF and ePub downloads, according to the available data) and Abstracts Views on Vision4Press platform.
Data correspond to usage on the plateform after 2015. The current usage metrics is available 48-96 hours after online publication and is updated daily on week days.
Initial download of the metrics may take a while.