Fig. 8
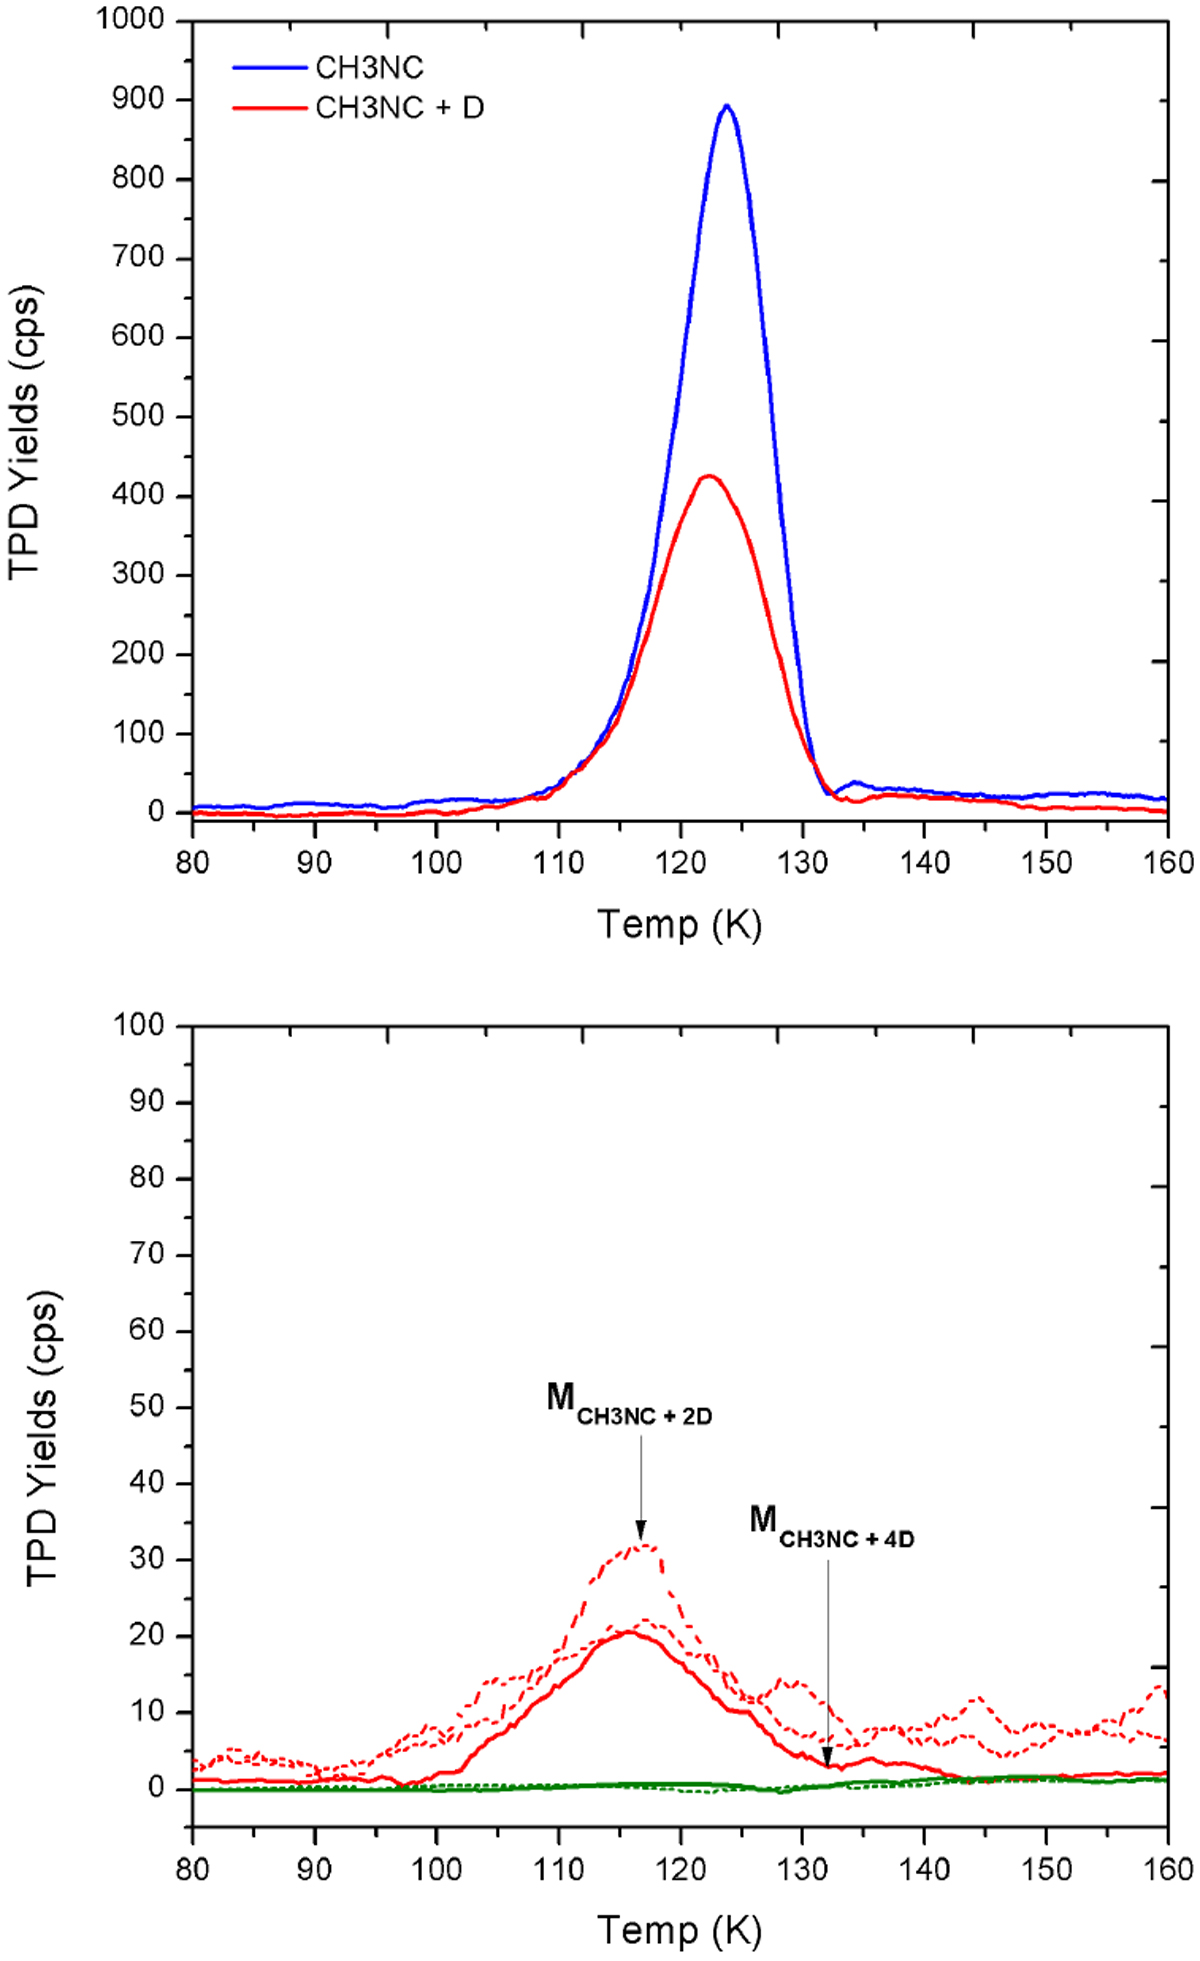
Top panel: pure CH3NC (m/z 41 – blue curve) and remaining CH3NC (m/z 41 – red curve) after completing the reaction with D atoms at 10 K. Bottom panel: TPD traces of mass 45 (M![]() + 2D-solid red curve) and cracking pattern (m/z 43, and 44) (dashed red curves) corresponding to CH3NCD2. No traces of CH3NDCD3
are detected (M
+ 2D-solid red curve) and cracking pattern (m/z 43, and 44) (dashed red curves) corresponding to CH3NCD2. No traces of CH3NDCD3
are detected (M![]() + 4D-solid green curve).
+ 4D-solid green curve).
Current usage metrics show cumulative count of Article Views (full-text article views including HTML views, PDF and ePub downloads, according to the available data) and Abstracts Views on Vision4Press platform.
Data correspond to usage on the plateform after 2015. The current usage metrics is available 48-96 hours after online publication and is updated daily on week days.
Initial download of the metrics may take a while.