Fig. 7
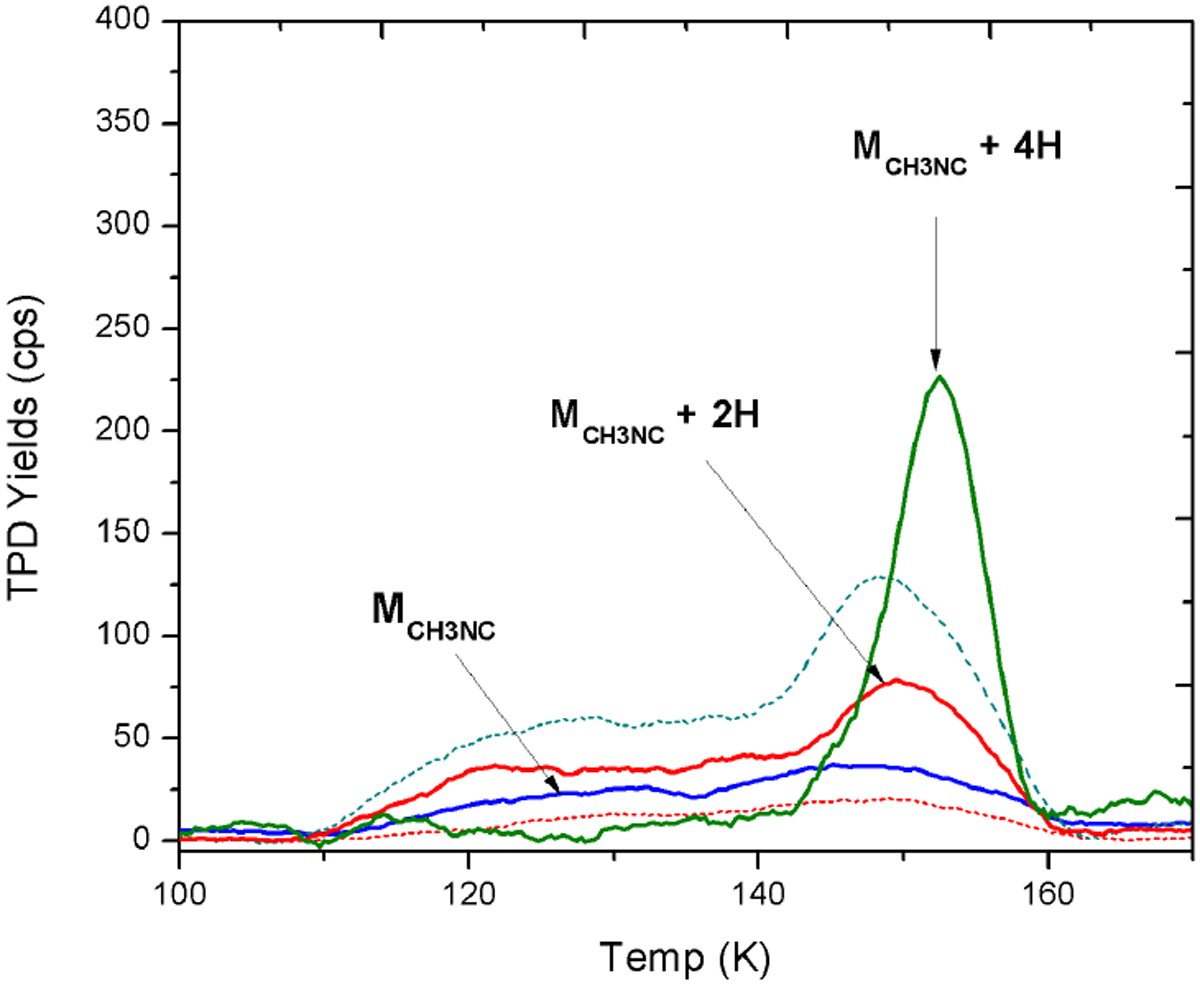
TPD profiles of the reactivity between CH3NC and H atomsin the presence of H2O. CH3NHCH3 (MCH 3NC + 4H)(solid green curve) is enhanced after completing the deposition. A part of CH3NC (MCH 3NC – solid blue curve) and CH3NCH2 (MCH 3NC + 2H – solid red curve) desorb before H2O and the other part is trapped and desorbed with H2O.
Current usage metrics show cumulative count of Article Views (full-text article views including HTML views, PDF and ePub downloads, according to the available data) and Abstracts Views on Vision4Press platform.
Data correspond to usage on the plateform after 2015. The current usage metrics is available 48-96 hours after online publication and is updated daily on week days.
Initial download of the metrics may take a while.