Fig. 5
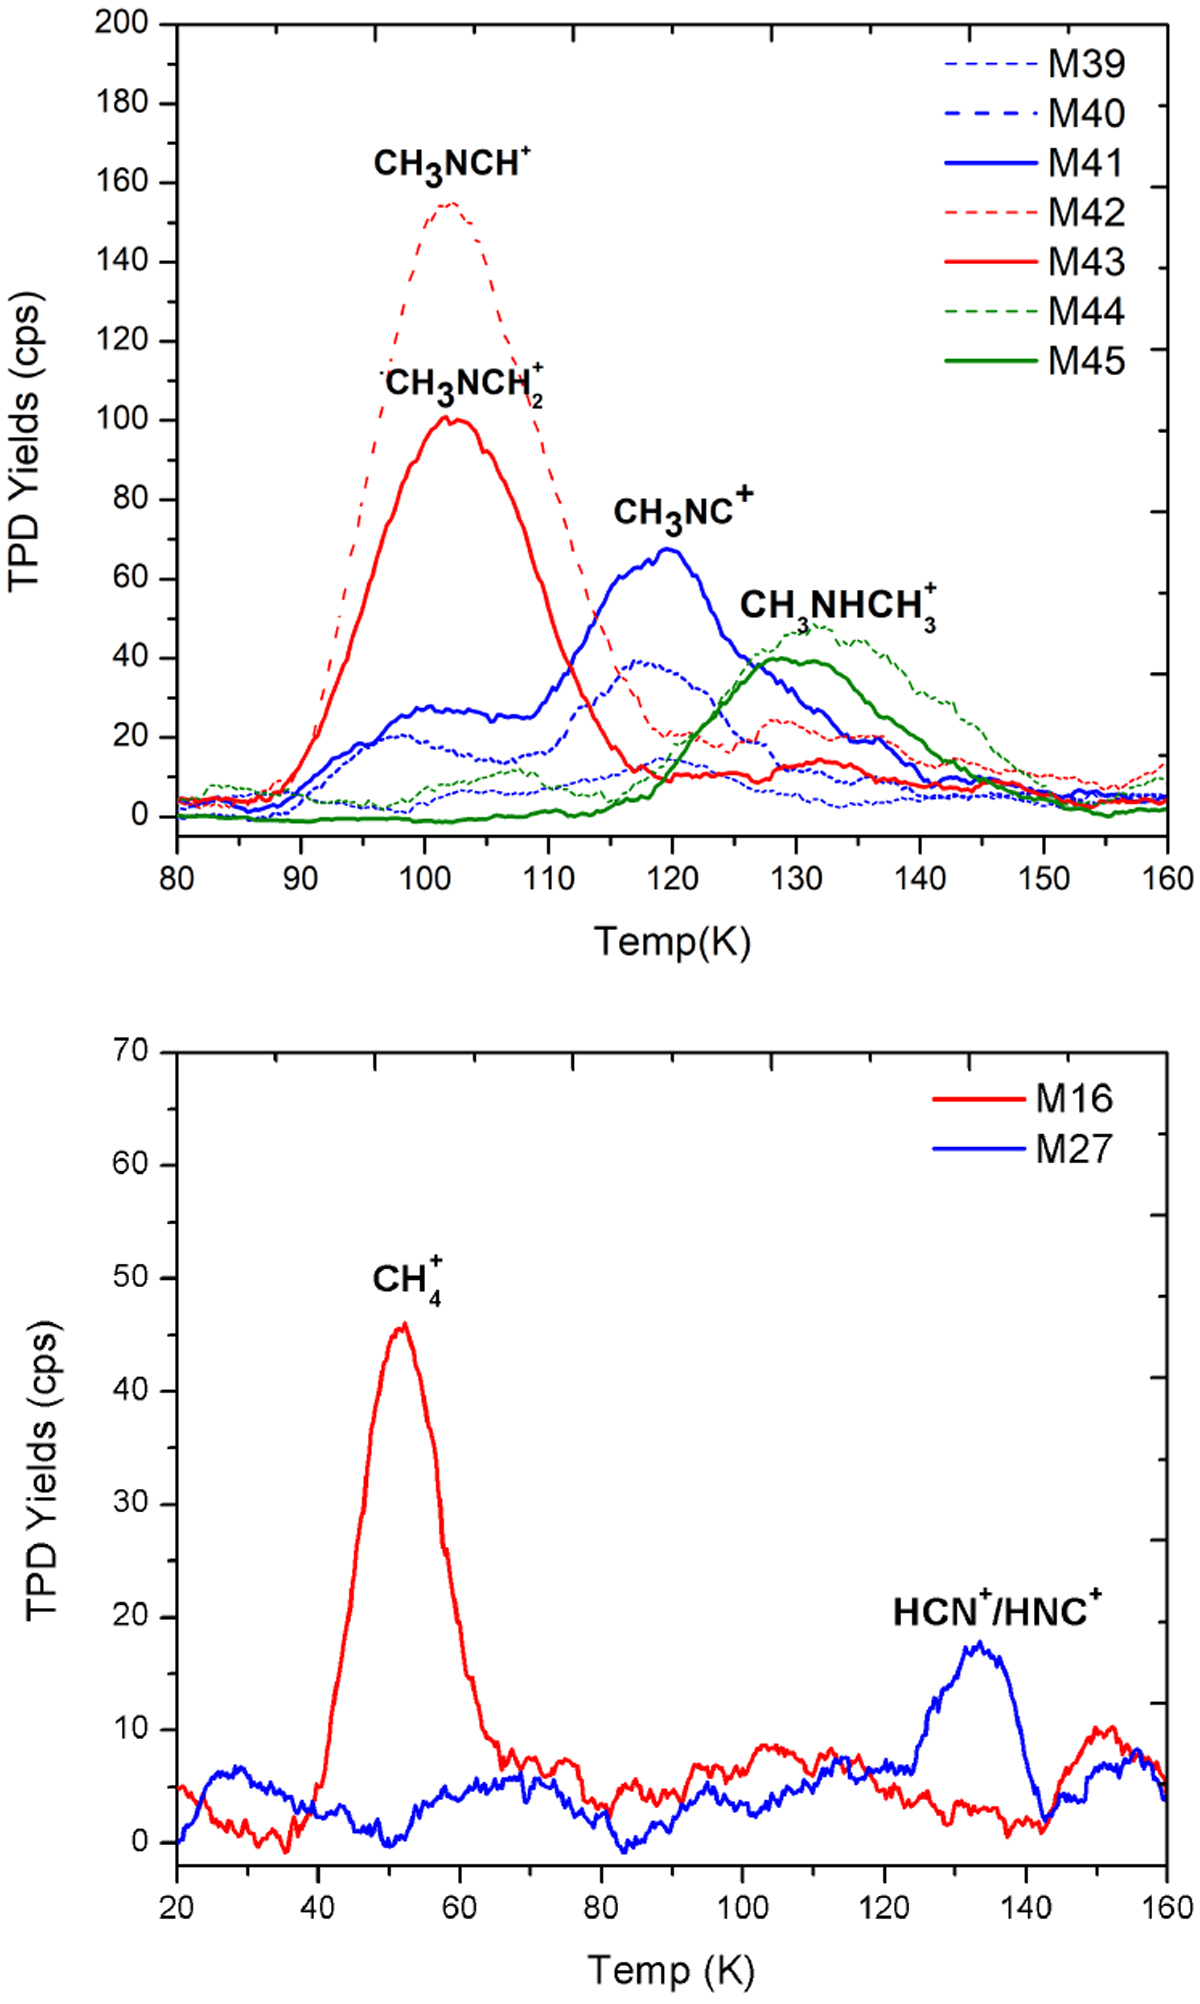
Top panel: TPD traces of CH3NCH![]() (m/z 43 – solid red curve) and cracking pattern m/z 42 (CH3NCH+ – dashed red curve) desorb around 90–115 K; remaining CH3NC+ (m/z 41) (solid blue curve) and cracking pattern m/z 39 and 40 (dash blue curves) desorb around 110–125 K; finally, dimethylamine (CH3NHCH
(m/z 43 – solid red curve) and cracking pattern m/z 42 (CH3NCH+ – dashed red curve) desorb around 90–115 K; remaining CH3NC+ (m/z 41) (solid blue curve) and cracking pattern m/z 39 and 40 (dash blue curves) desorb around 110–125 K; finally, dimethylamine (CH3NHCH![]() ) (m/z 45 – solid green curve) and cracking patterns m/z 44 (dash green curve),
m/z 43 (solid red curve), and m/z 42 (dash red curve) desorb around 120–145 K.
Bottom panel: TPD traces of CH
) (m/z 45 – solid green curve) and cracking patterns m/z 44 (dash green curve),
m/z 43 (solid red curve), and m/z 42 (dash red curve) desorb around 120–145 K.
Bottom panel: TPD traces of CH![]() (red curve) and HCN+
(or HNC+) (blue curve) are formed from other chemical pathways between CH3NC and H atoms.
(red curve) and HCN+
(or HNC+) (blue curve) are formed from other chemical pathways between CH3NC and H atoms.
Current usage metrics show cumulative count of Article Views (full-text article views including HTML views, PDF and ePub downloads, according to the available data) and Abstracts Views on Vision4Press platform.
Data correspond to usage on the plateform after 2015. The current usage metrics is available 48-96 hours after online publication and is updated daily on week days.
Initial download of the metrics may take a while.