Fig. 4
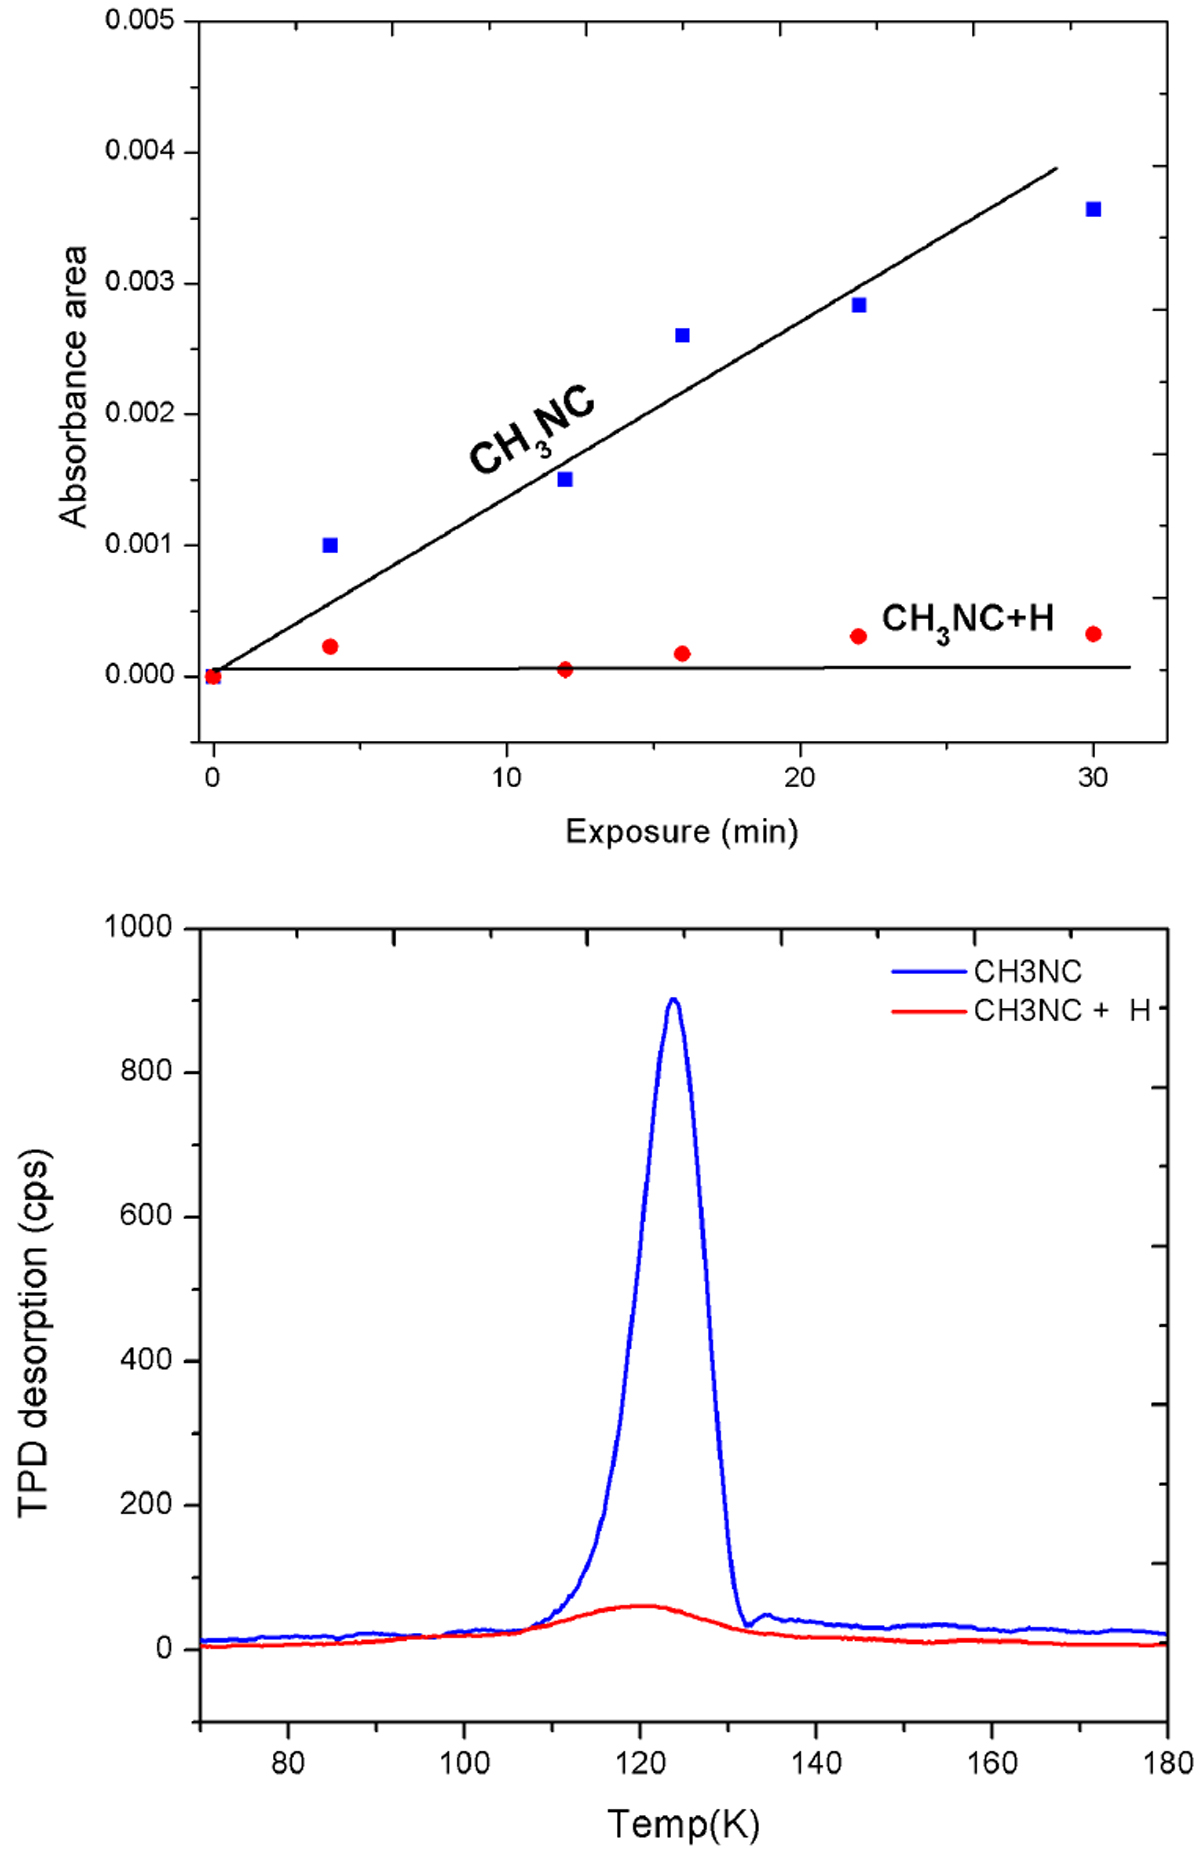
Top panel: evolution of the area of the 2176 cm−1 IR band of CH3NC as a functionof deposition time on the substrate held at 10 K. {CH3NC} deposition inblue, and {CH3NC+H} co-deposition in red. Bottom panel: TPD trace (m/z 41) of pure {CH3NC} (blue curve) and the remaining part of CH3NC (red curve) obtained after the same depositions.
Current usage metrics show cumulative count of Article Views (full-text article views including HTML views, PDF and ePub downloads, according to the available data) and Abstracts Views on Vision4Press platform.
Data correspond to usage on the plateform after 2015. The current usage metrics is available 48-96 hours after online publication and is updated daily on week days.
Initial download of the metrics may take a while.