Open Access
Fig. 10
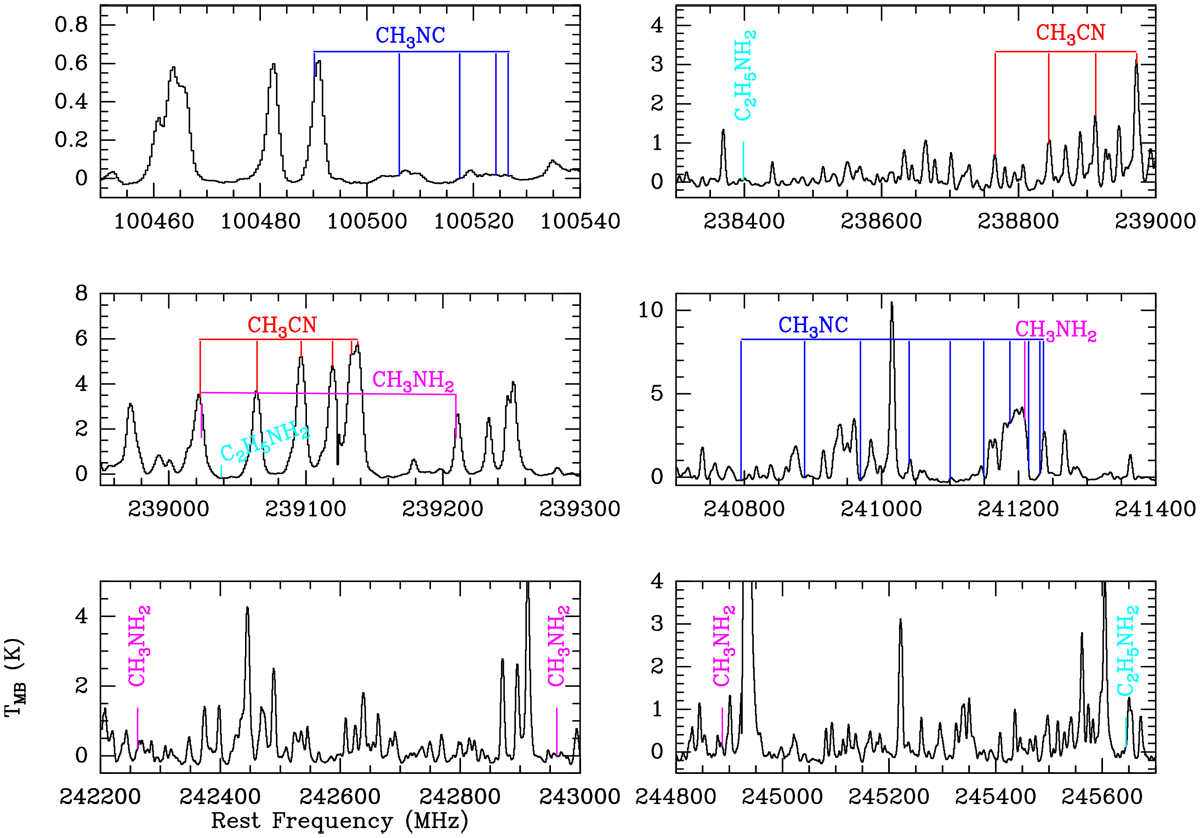
Portion of the W51/e2 spectra as observed at 1 and 3 mm with the IRAM 30 m telescope. Line assignmentd of CH3CN (red), CH3NC (blue), C2H5NH2 (cyan), and CH3NH2 (magenta) are indicated on top of the spectra.
Current usage metrics show cumulative count of Article Views (full-text article views including HTML views, PDF and ePub downloads, according to the available data) and Abstracts Views on Vision4Press platform.
Data correspond to usage on the plateform after 2015. The current usage metrics is available 48-96 hours after online publication and is updated daily on week days.
Initial download of the metrics may take a while.