Fig. 7.
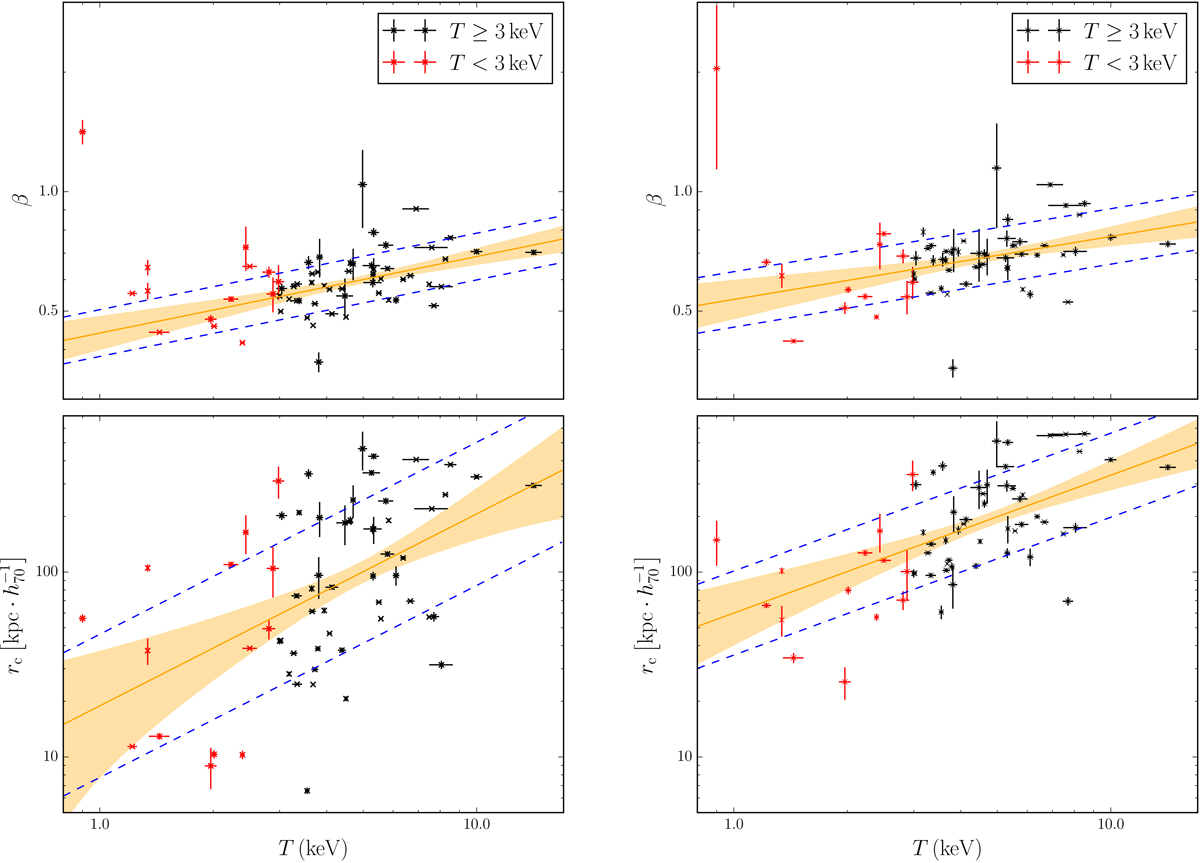
Scaling relations between single β-model (left panels) and core-modeled single β-model (right panels) parameters and temperature. The HIFLUGCS clusters with temperatures greater than 3 keV (black points) are used for optimization. Red points mark HIFLUGCS objects below this temperature threshold for visualization. The orange lines and shaded regions show the best-fit relations and their uncertainties, respectively. The blue dashed lines correspond to the intrinsic log-normal scatter.
Current usage metrics show cumulative count of Article Views (full-text article views including HTML views, PDF and ePub downloads, according to the available data) and Abstracts Views on Vision4Press platform.
Data correspond to usage on the plateform after 2015. The current usage metrics is available 48-96 hours after online publication and is updated daily on week days.
Initial download of the metrics may take a while.