Fig. D.1.
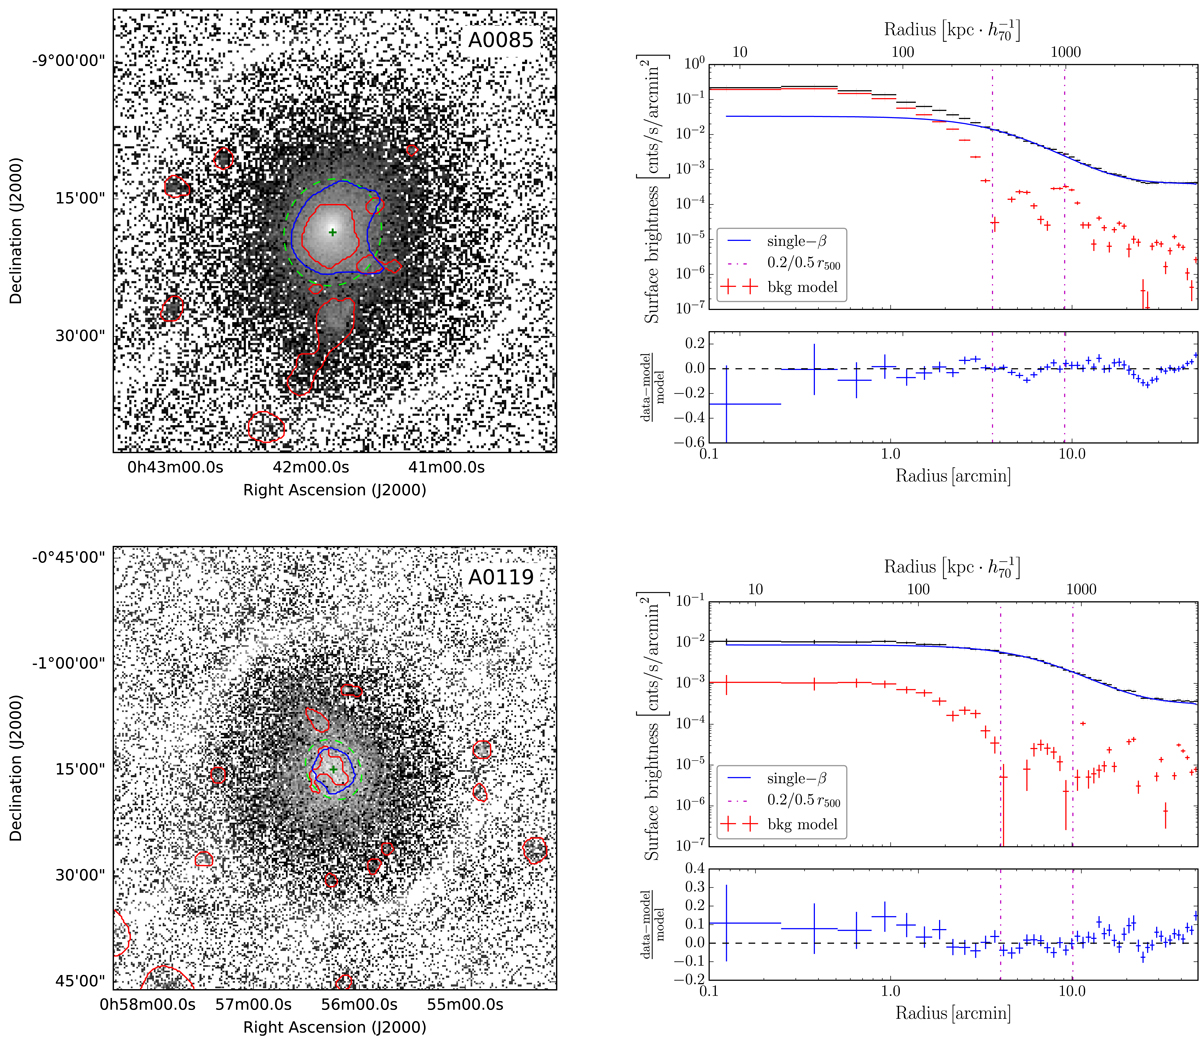
Left panels: ROSAT count rate images for individual galaxy clusters. The large-scale centers are shown as green plus signs. Red contours correspond to wavelet scales used for background modeling. The large scales (the ones above 0.2 r500) are shown as blue contours. These large scales are used to calculate the center and ellipticities. The extracted SExtractor ellipses are displayed in dashed green. Each box size corresponds to the outer significance radius of the shown cluster. Right panels: top panels show the measured (black points) surface brightness profiles of individual galaxy clusters. The background models used for the single β-model fits (solid blue lines) are shown as red points. Bottom panels: residuals of the core-modelled single β-model fits.
Current usage metrics show cumulative count of Article Views (full-text article views including HTML views, PDF and ePub downloads, according to the available data) and Abstracts Views on Vision4Press platform.
Data correspond to usage on the plateform after 2015. The current usage metrics is available 48-96 hours after online publication and is updated daily on week days.
Initial download of the metrics may take a while.