Fig. 9.
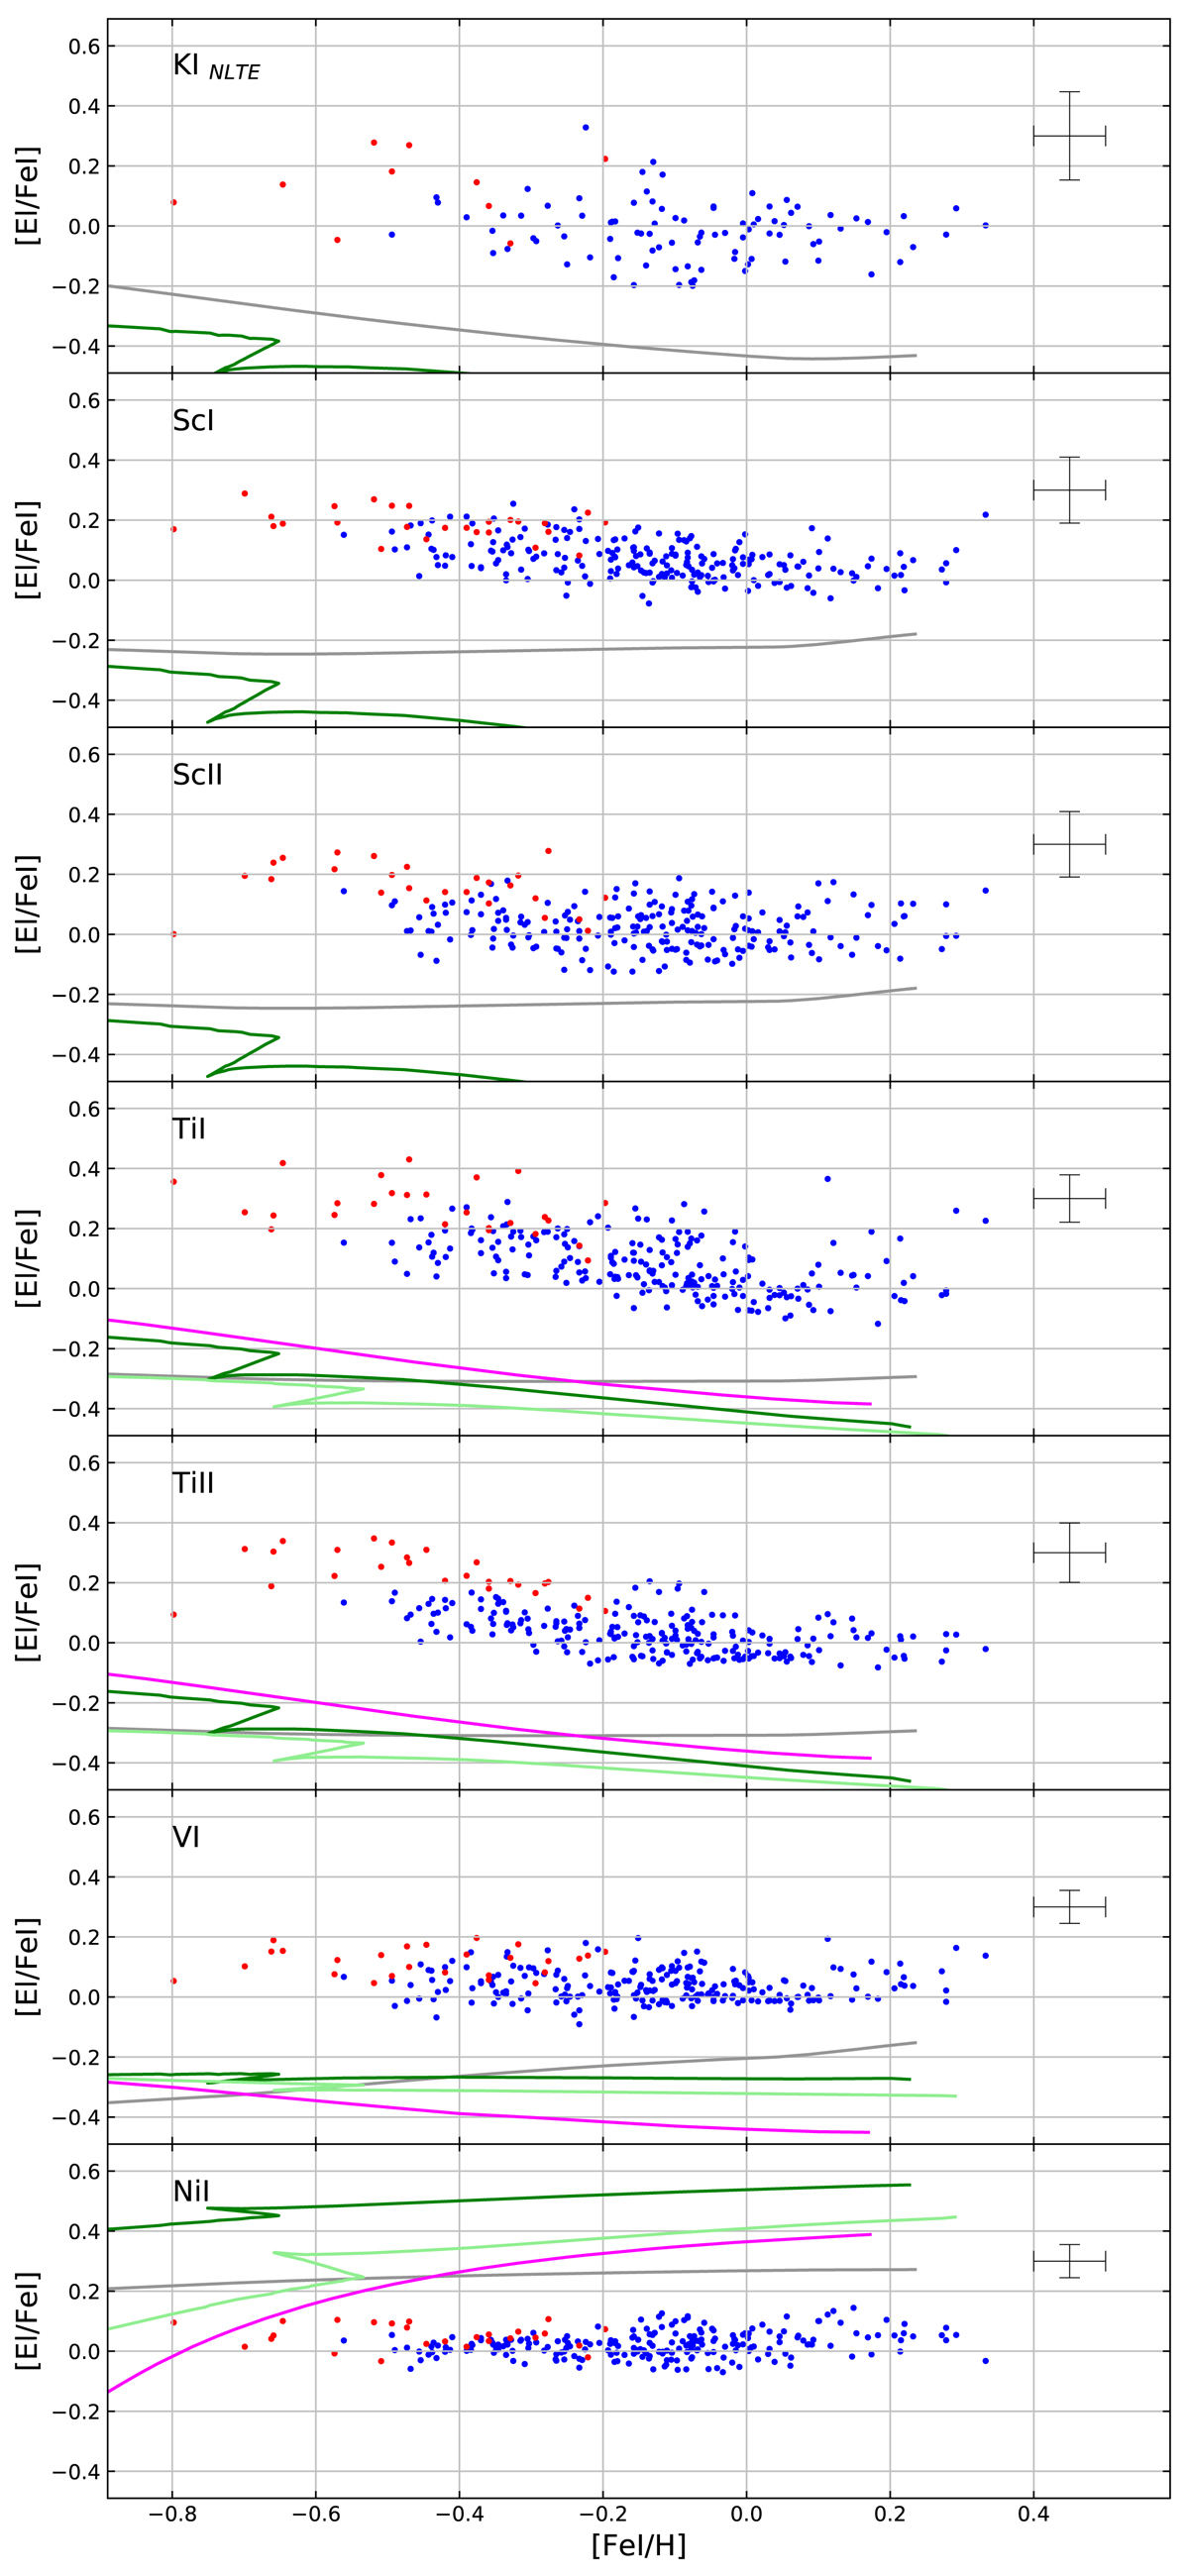
Observed element-to-iron abundance ratios as a function of the [Fe I/H] abundance. Cases where all models fail to represent the data. Shown are the Romano et al. (2010) R1 model (dark green line) and R15 model (light green line), the Kobayashi & Nakasato (2011) thin disc model (magenta line), and the Prantzos et al. (2018) baseline model (grey line).
Current usage metrics show cumulative count of Article Views (full-text article views including HTML views, PDF and ePub downloads, according to the available data) and Abstracts Views on Vision4Press platform.
Data correspond to usage on the plateform after 2015. The current usage metrics is available 48-96 hours after online publication and is updated daily on week days.
Initial download of the metrics may take a while.