Fig. 7.
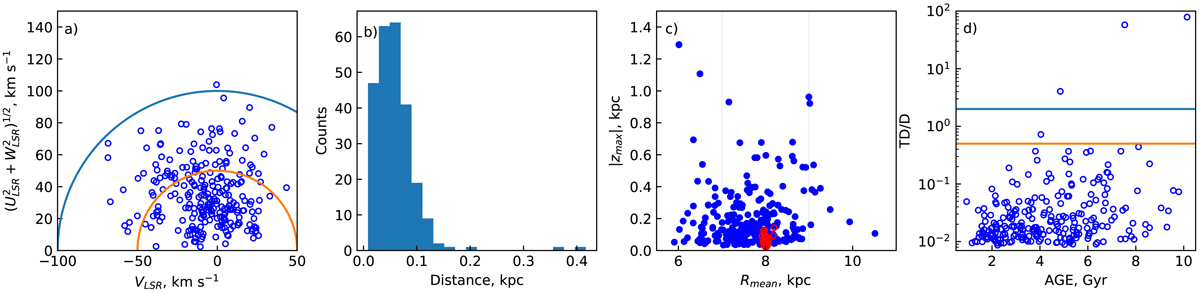
Kinematic parameters: (a) Toomre diagram of sample data with lines that show constant values of the total space velocity (vtot = (ULSR + VLSR + WLSR)1/2)) at 50 and 100 km s−1; (b) histogram of distances of sample stars; (c) distribution of sample stars in zmax vs. Rmean plane, where the two vertical dashed lines delimit the solar neighbourhood 7 < Rgc < 9 kpc and red circles are current positions (|z| vs. R) for comparison; (d) kinematical thick-to-thin disc probability ratios (TD/D) vs. age for the sample stars, where the upper and lower lines mark TD/D = 2.0 and TD/D = 0.5, respectively.
Current usage metrics show cumulative count of Article Views (full-text article views including HTML views, PDF and ePub downloads, according to the available data) and Abstracts Views on Vision4Press platform.
Data correspond to usage on the plateform after 2015. The current usage metrics is available 48-96 hours after online publication and is updated daily on week days.
Initial download of the metrics may take a while.