Fig. 5.
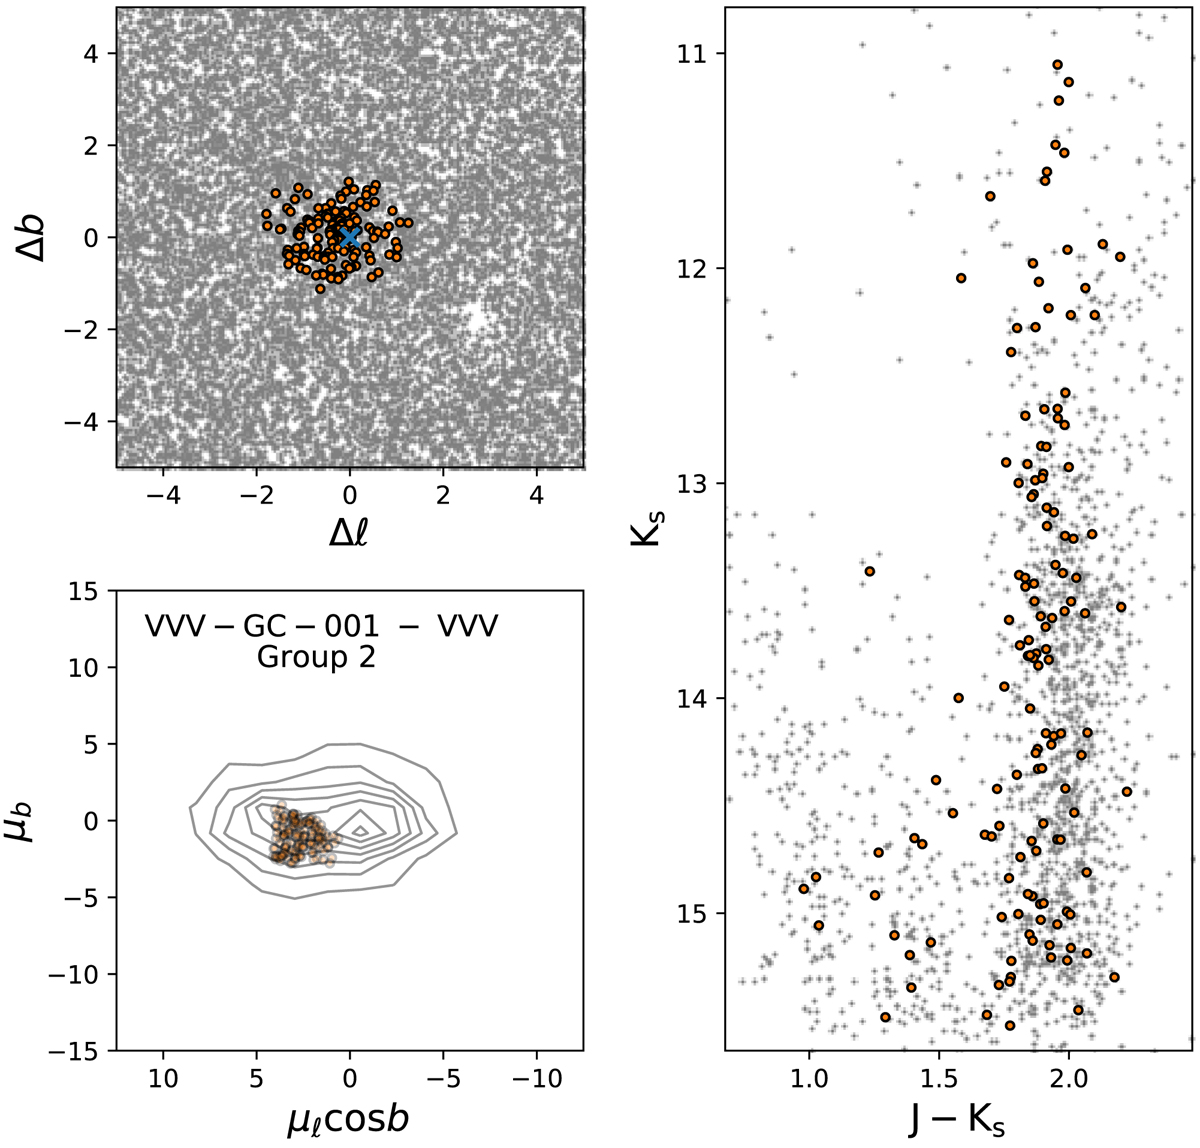
Diagnostic plots for GC001. Stars within 2 arcmins from the nominal cluster center were used to perform the clustering algorithm. The spatial distribution of stars (Group 2 defined by the code) that comprise the GC are shown in orange points (upper left), plotted in the VPD (bottom left) and in the CMD. We note that the distribution of cluster stars is shifted with respect to the contours of the total distribution of stars in the VPD.
Current usage metrics show cumulative count of Article Views (full-text article views including HTML views, PDF and ePub downloads, according to the available data) and Abstracts Views on Vision4Press platform.
Data correspond to usage on the plateform after 2015. The current usage metrics is available 48-96 hours after online publication and is updated daily on week days.
Initial download of the metrics may take a while.