Fig. 1.
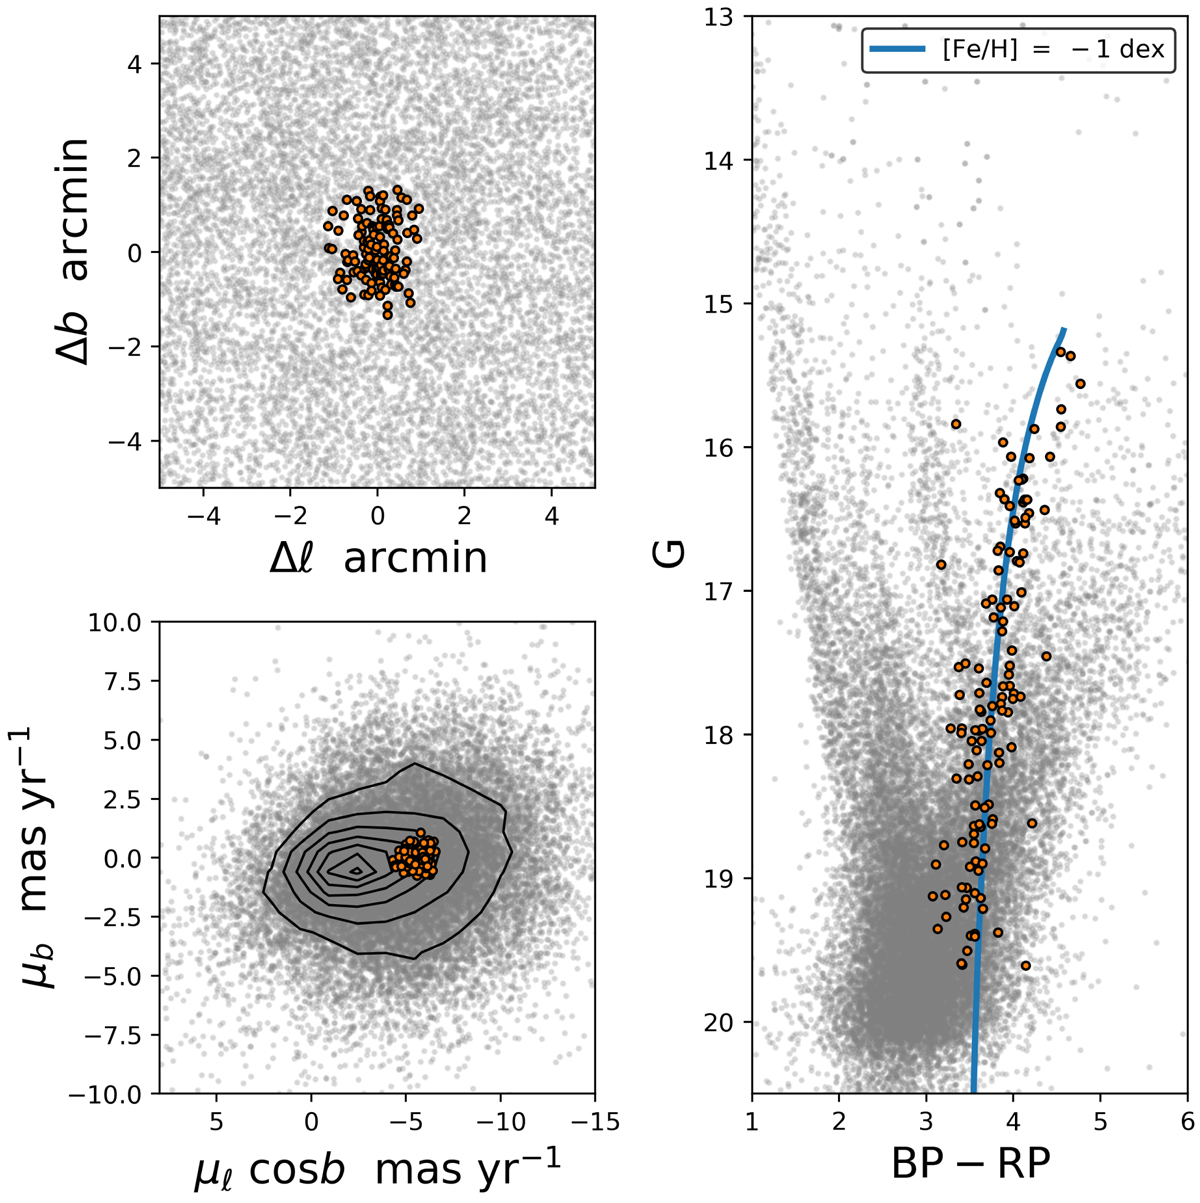
Globular cluster Terzan 1 as detected by our algorithm. The orange points represent the detected overdensity along with background stars (gray points) within 15 arcmins from the detected cluster centroid. The gray stars define three populated sequences from left to right: the disk MS, disk red clump (both spread along the line of sight), and the bulge upper red giant branch with a PGPUC isochrone overplotted.
Current usage metrics show cumulative count of Article Views (full-text article views including HTML views, PDF and ePub downloads, according to the available data) and Abstracts Views on Vision4Press platform.
Data correspond to usage on the plateform after 2015. The current usage metrics is available 48-96 hours after online publication and is updated daily on week days.
Initial download of the metrics may take a while.