Fig. 9.
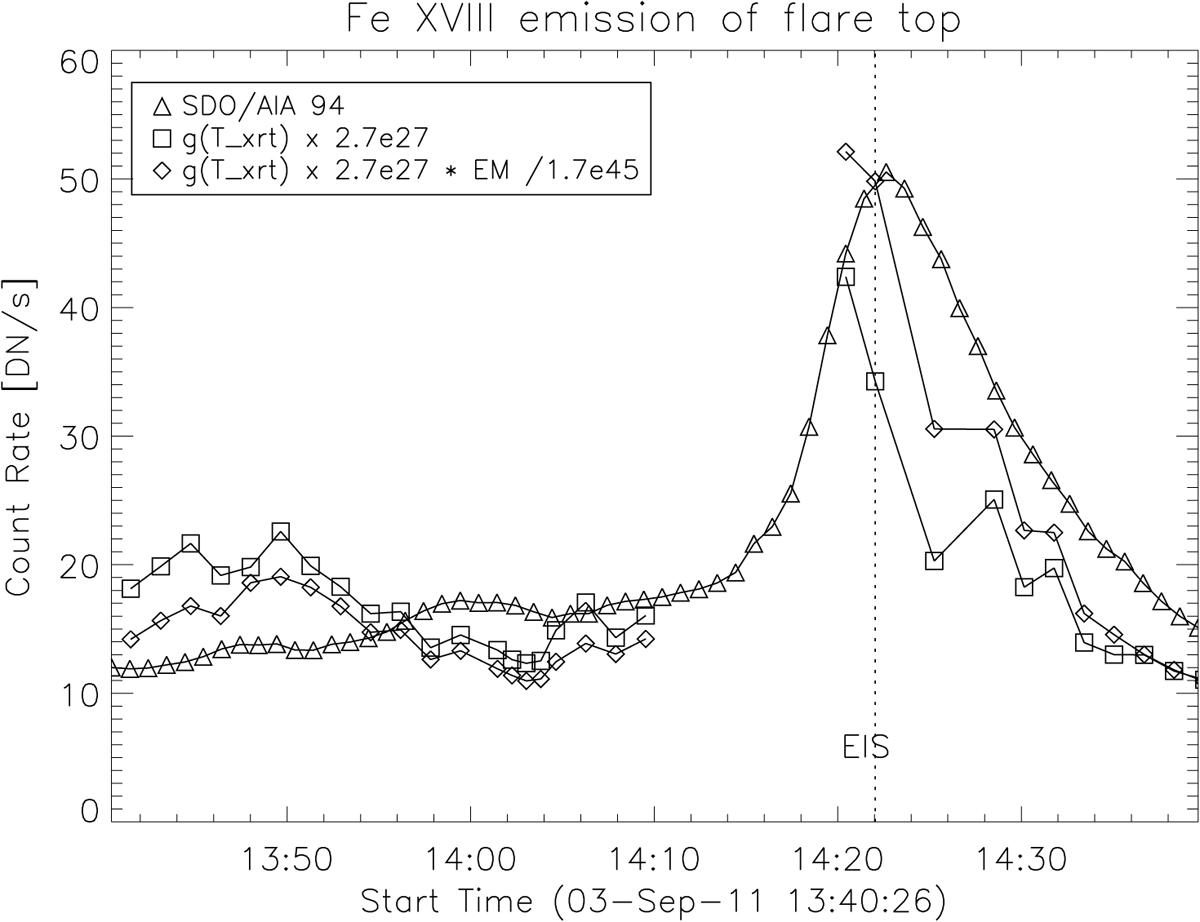
Relative increase in AIA Fe XVIII signal in lower loop-top. These are estimated from the AIA 94 Å signal (triangles), as obtained from the increased emissivity of the line due to the temperature variation obtained from XRT (squares), and as obtained by combining the increase in the emissivity and the emission measure (diamonds). The dashed, vertical lines indicate the timings of the EIS observation during the microflare peak.
Current usage metrics show cumulative count of Article Views (full-text article views including HTML views, PDF and ePub downloads, according to the available data) and Abstracts Views on Vision4Press platform.
Data correspond to usage on the plateform after 2015. The current usage metrics is available 48-96 hours after online publication and is updated daily on week days.
Initial download of the metrics may take a while.