Fig. 8.
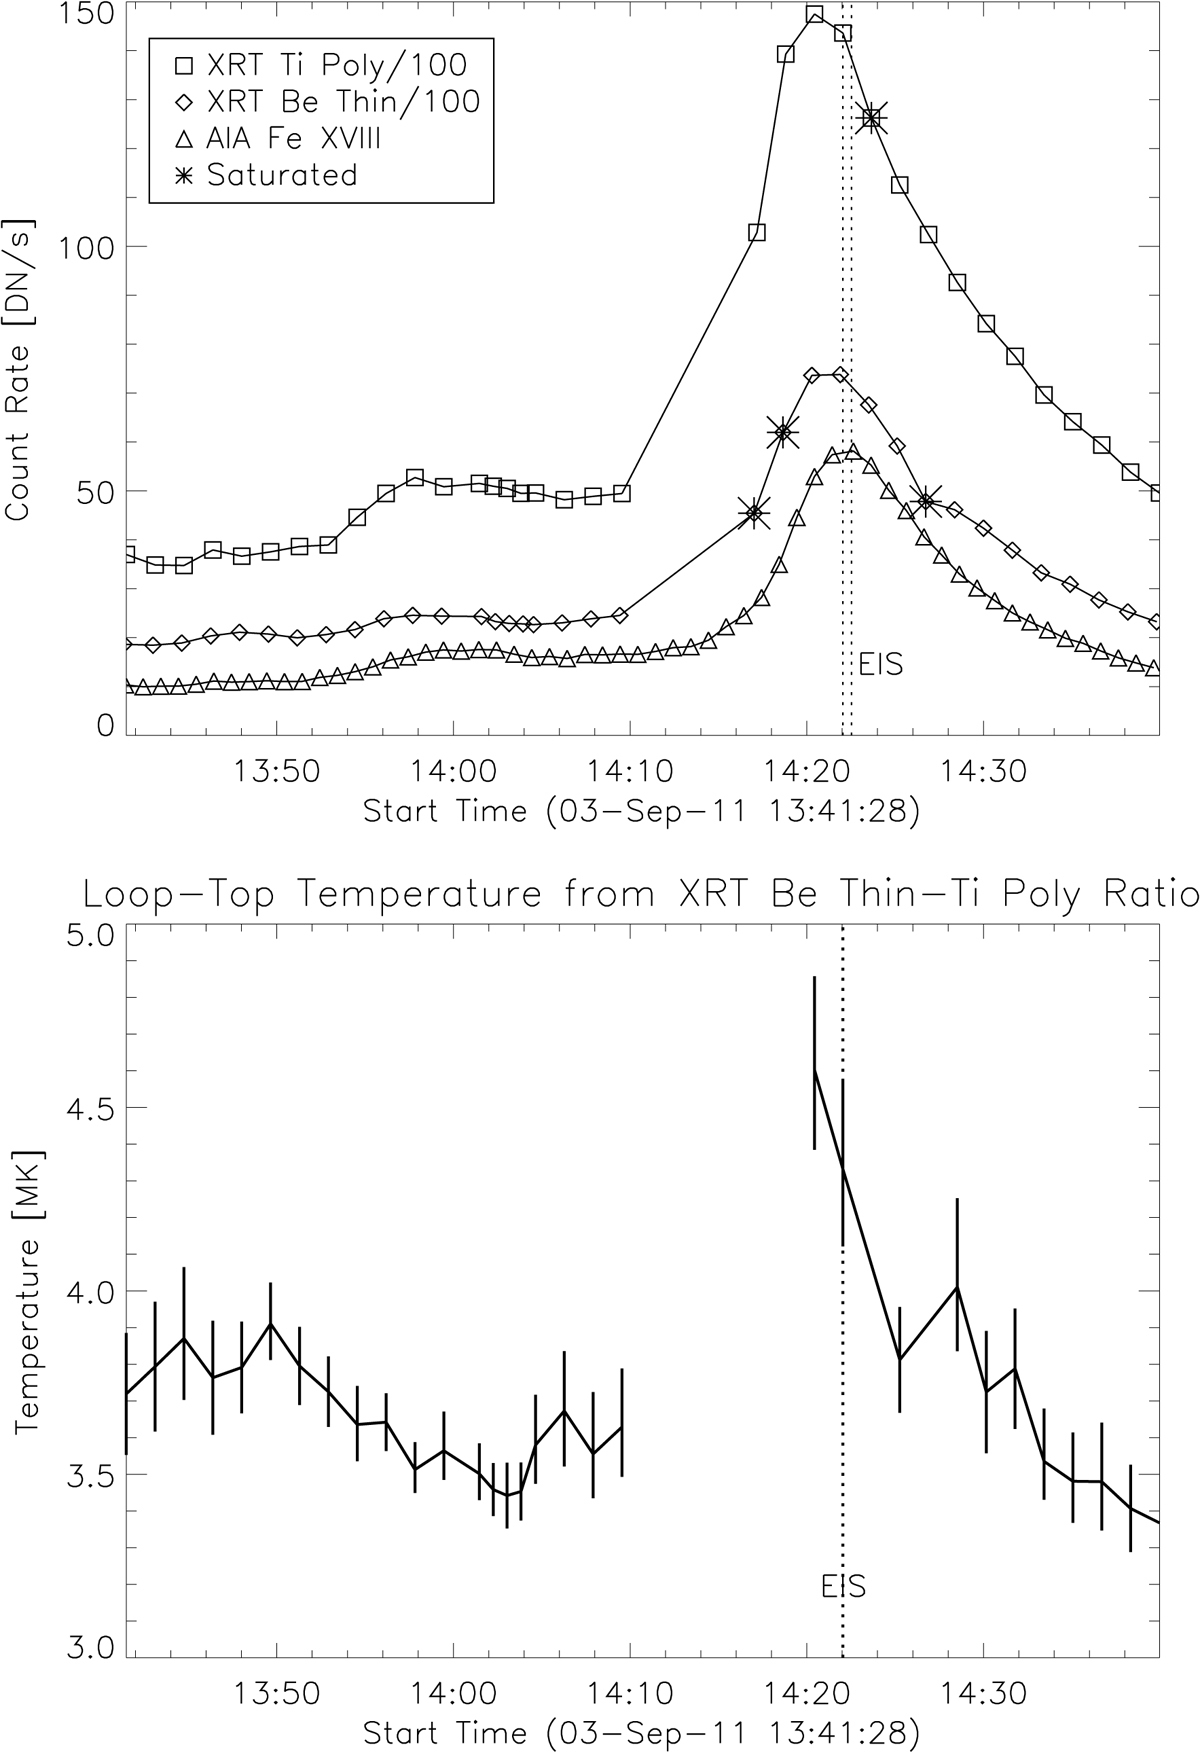
Temporal microflare evolution. Top: averaged count rates of the data inside the box of the two XRT filters (Ti-Poly and Be-Thin, squares and diamonds respectively), both divided by 100, as well as the reconstructed Fe XVIII emission from the AIA filters (triangles). Saturated data points in XRT are marked with an asterisk, and the vertical lines enclose the timing of the EIS observation of the same data interval. Bottom: temporal evolution of the temperature inside the box, obtained from XRT filter ratios. The dashed, vertical line indicates the time of the EIS observation in the same region.
Current usage metrics show cumulative count of Article Views (full-text article views including HTML views, PDF and ePub downloads, according to the available data) and Abstracts Views on Vision4Press platform.
Data correspond to usage on the plateform after 2015. The current usage metrics is available 48-96 hours after online publication and is updated daily on week days.
Initial download of the metrics may take a while.