Free Access
Fig. B.3.
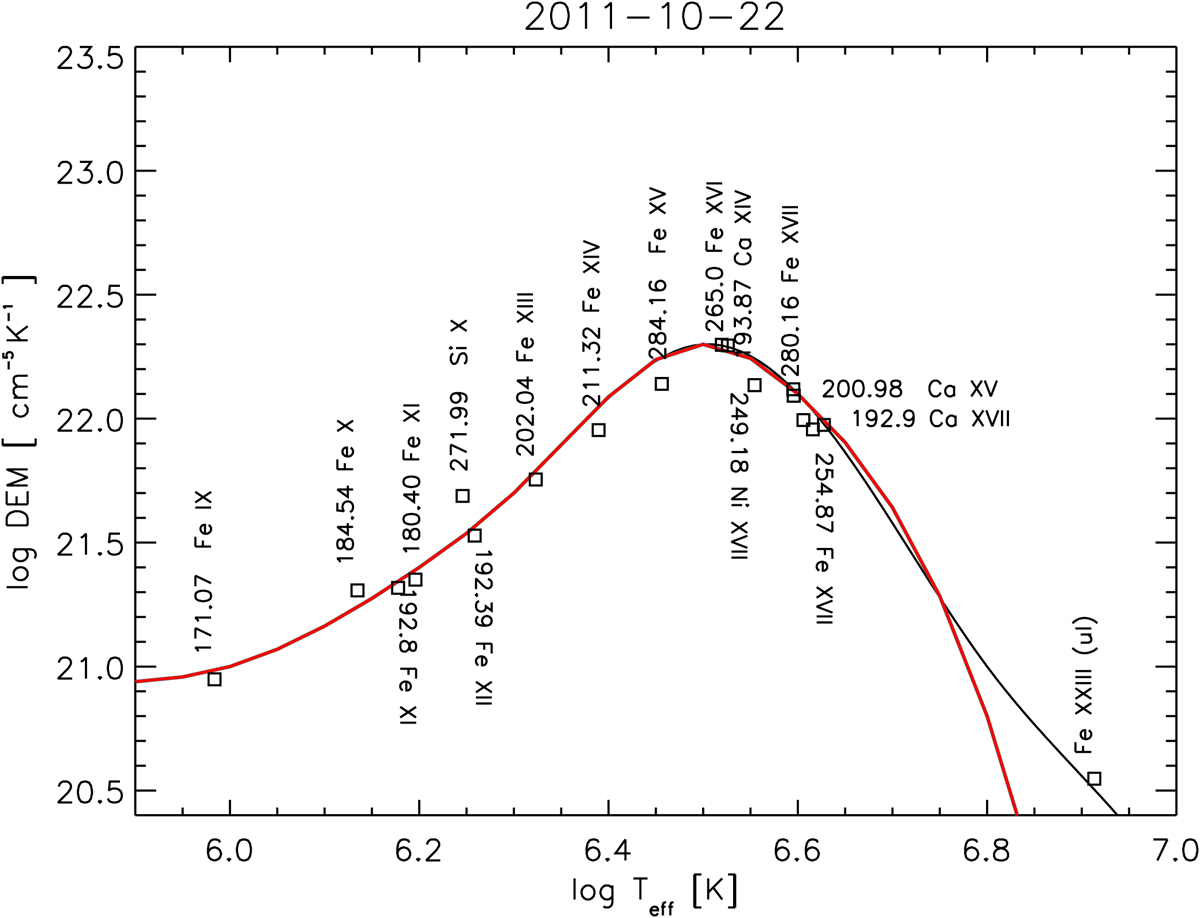
DEM of microflare region on 2011 October 22. The black line was derived using an upper limit for the Fe XXIII count rates, while the red line had this limit set to 0.
Current usage metrics show cumulative count of Article Views (full-text article views including HTML views, PDF and ePub downloads, according to the available data) and Abstracts Views on Vision4Press platform.
Data correspond to usage on the plateform after 2015. The current usage metrics is available 48-96 hours after online publication and is updated daily on week days.
Initial download of the metrics may take a while.