Free Access
Fig. B.1.
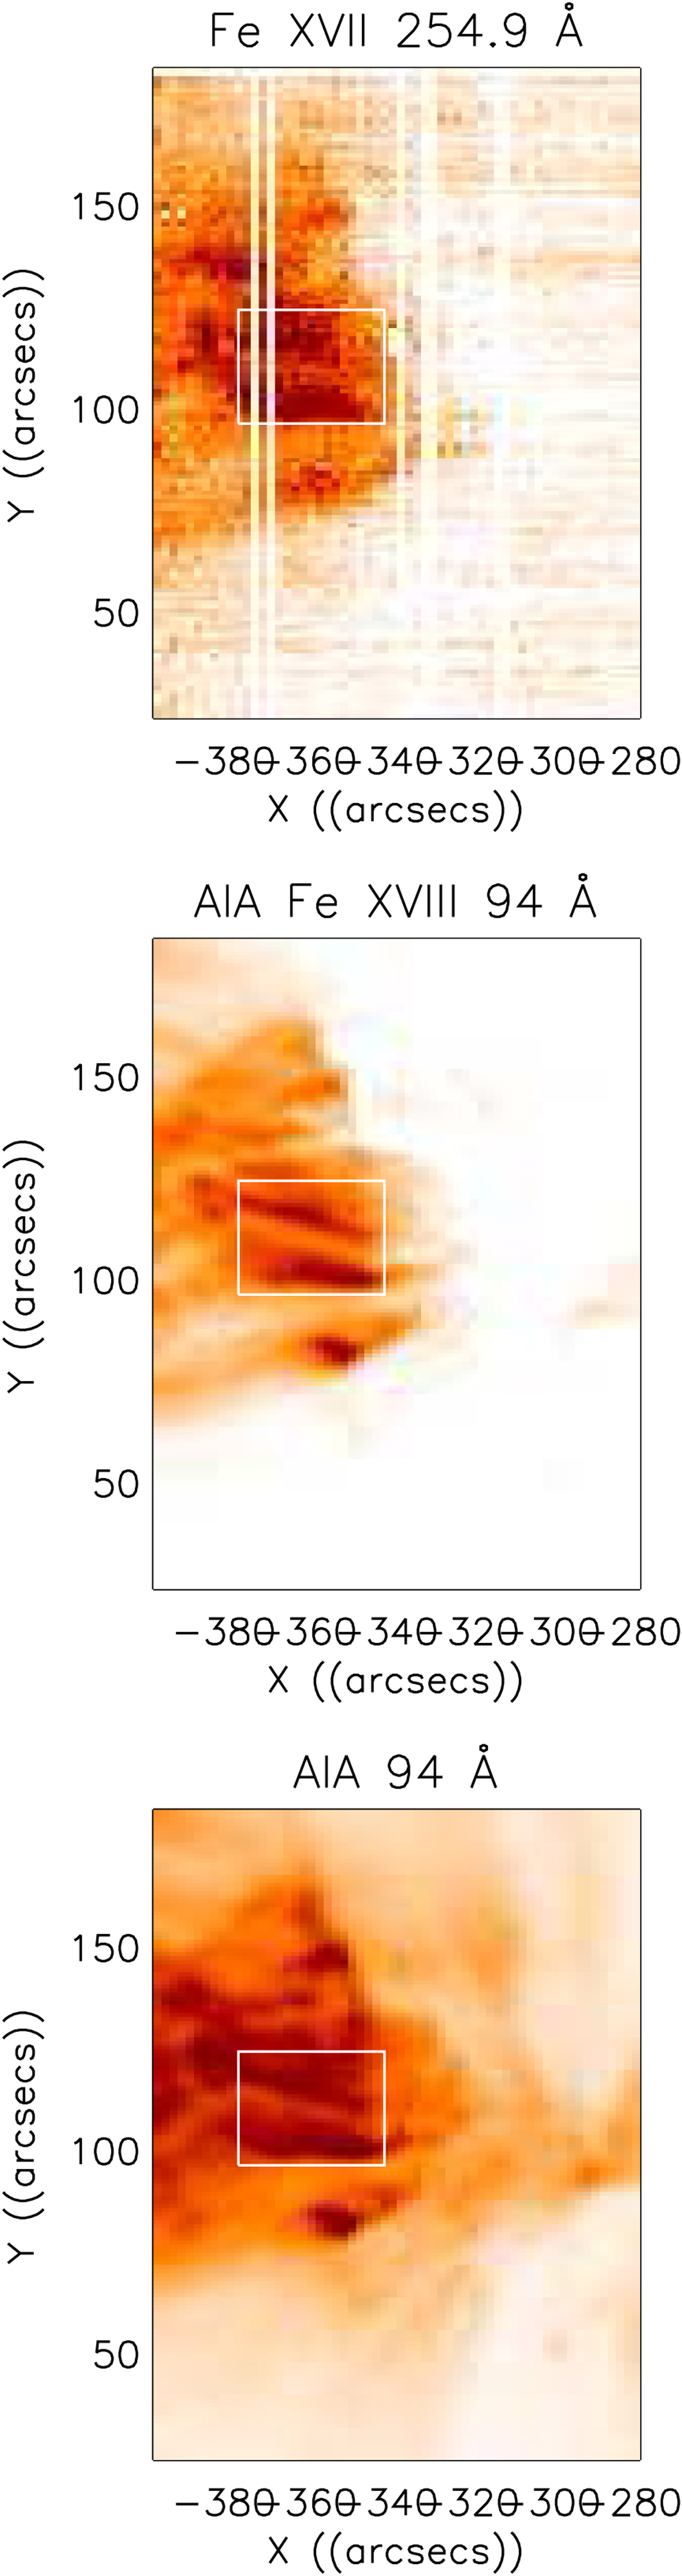
Top: monochromatic image in Fe XVII of EIS raster on 2011 October 22. A microflare region selected for DEM analysis is shown with a box. Middle: estimated Fe XVIII emission in the AIA 94 Å band, downgraded to the spatial and temporal resolution of the EIS raster. Bottom: AIA 94 Å band image.
Current usage metrics show cumulative count of Article Views (full-text article views including HTML views, PDF and ePub downloads, according to the available data) and Abstracts Views on Vision4Press platform.
Data correspond to usage on the plateform after 2015. The current usage metrics is available 48-96 hours after online publication and is updated daily on week days.
Initial download of the metrics may take a while.