Fig. 11.
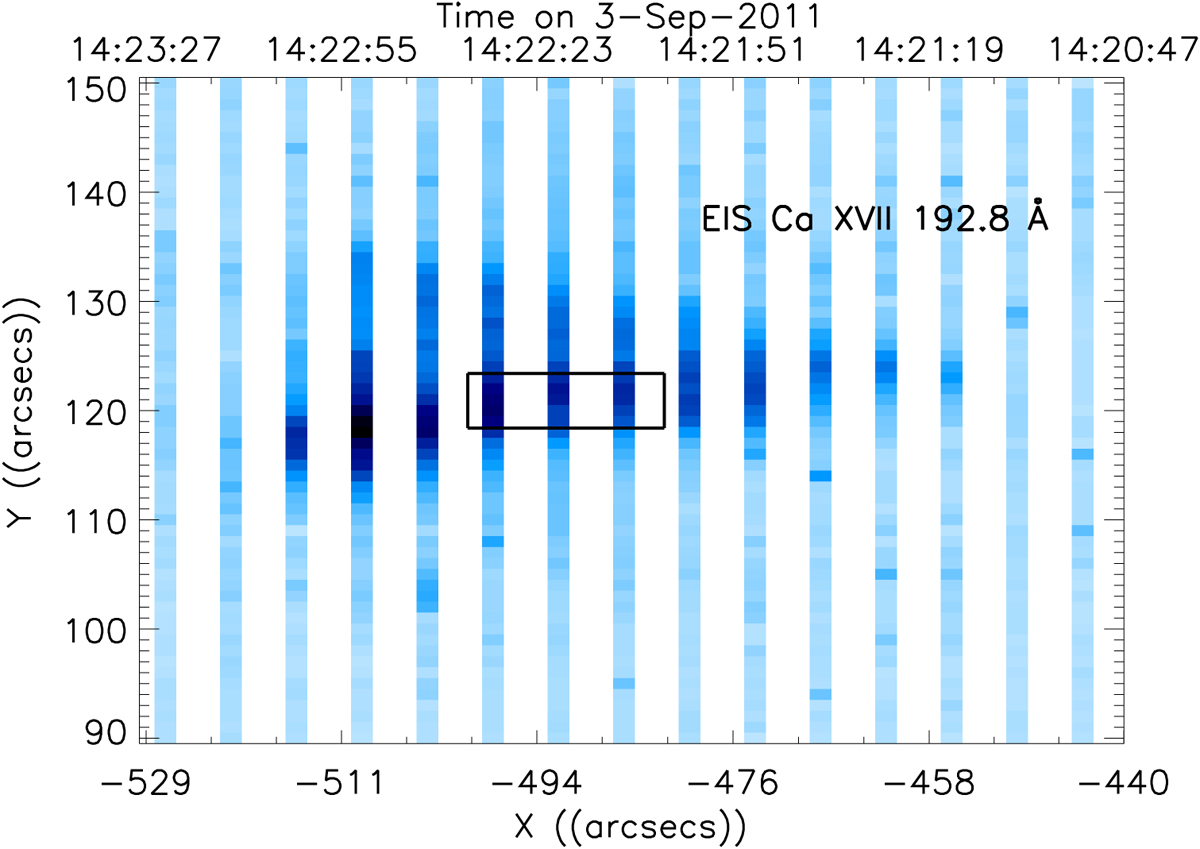
Hinode EIS monochromatic image of Ca XVII line at 192.8 Å of microflare. Due to rastering, data were only recorded at a sparse spatial resolution, with the white stripes indicate data gaps. Each vertical raster is taken 11 s apart. The time-axis is given at the top of the graph, with time running from right to left. The loop-top is marked by the black box, which was selected for further analysis. The spatial coordinates of the data were shifted in order to be aligned with SDO AIA observations.
Current usage metrics show cumulative count of Article Views (full-text article views including HTML views, PDF and ePub downloads, according to the available data) and Abstracts Views on Vision4Press platform.
Data correspond to usage on the plateform after 2015. The current usage metrics is available 48-96 hours after online publication and is updated daily on week days.
Initial download of the metrics may take a while.