Fig. 5.
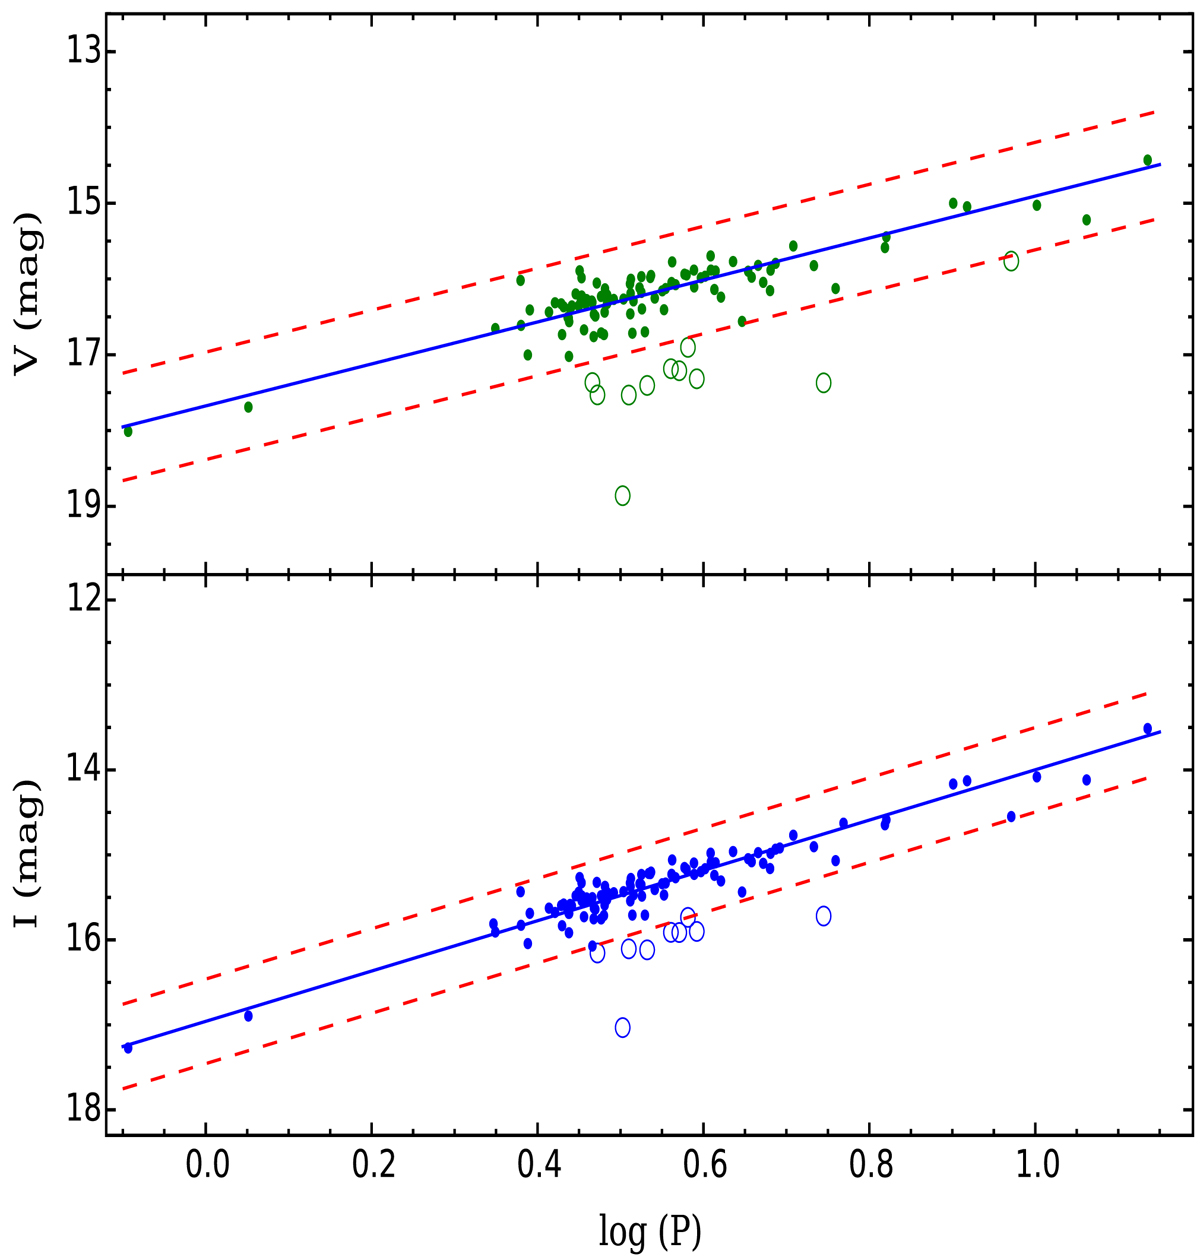
P–L relations for a sub-region in the LMC in the V band (upper panel) and I band (lower panel). Here, the continuous lines represent the best linear fit with a fixed slope of −2.769 for the V band and −2.961 for the I band, respectively. The dashed lines represent the 3σ cut lines and Cepheids outside 3σ lines are shown by open circles which are not considered in the best fit.
Current usage metrics show cumulative count of Article Views (full-text article views including HTML views, PDF and ePub downloads, according to the available data) and Abstracts Views on Vision4Press platform.
Data correspond to usage on the plateform after 2015. The current usage metrics is available 48-96 hours after online publication and is updated daily on week days.
Initial download of the metrics may take a while.