Fig. 13.
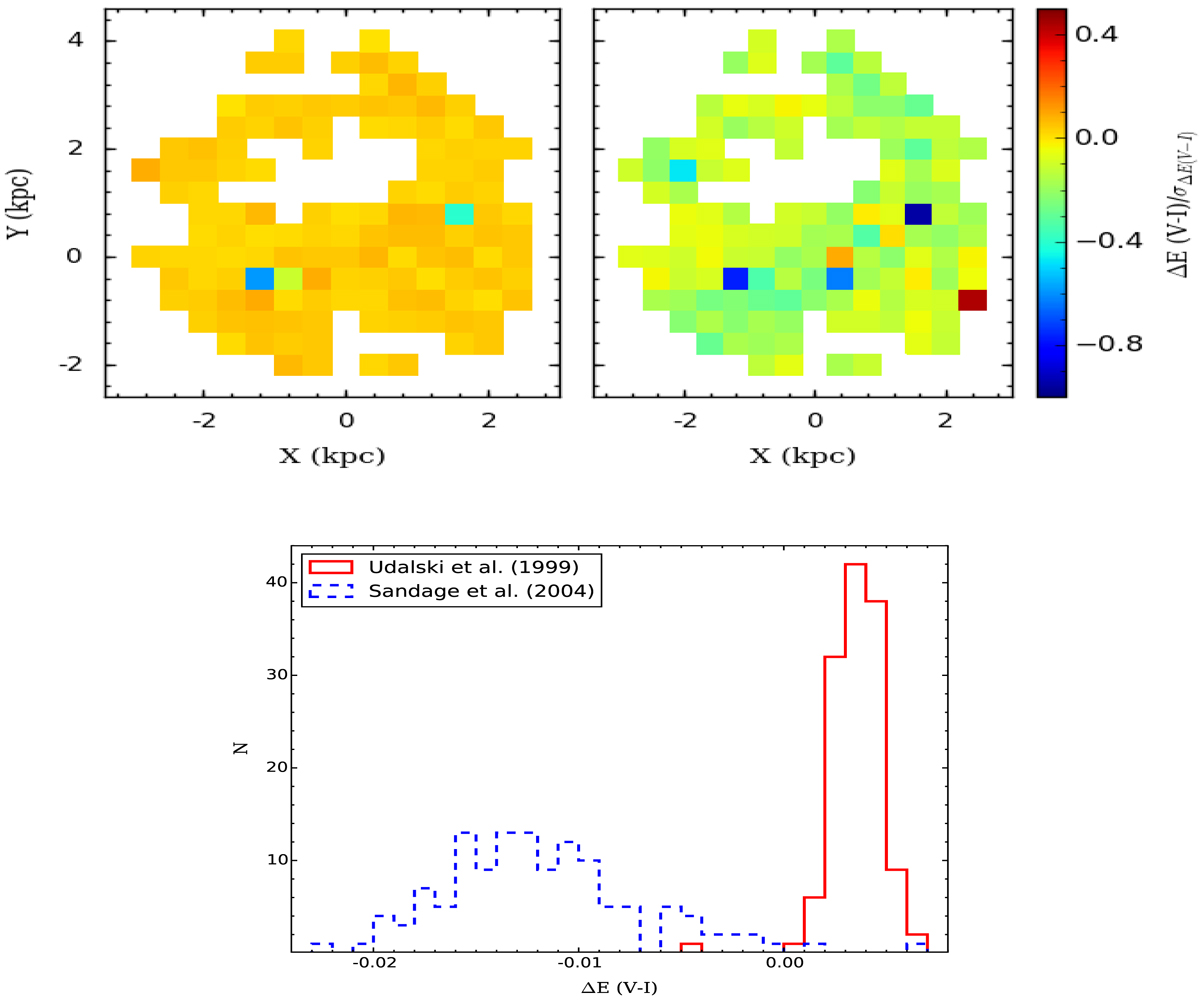
Lower panel: histogram of the difference Δ E(V − I) between the present study and those of Udalski et al. (1999) shown by a continuous line, and Sandage et al. (2004) shown by a dashed line. Upper panel: heat map representing the difference in reddening divided by reddening uncertainty in each segment, left panel – between the present reddening estimates and those of Udalski et al. (1999); right panel – between the present reddening estimates and those of Sandage et al. (2004). The difference is obtained by subtracting the results of other studies from our estimates.
Current usage metrics show cumulative count of Article Views (full-text article views including HTML views, PDF and ePub downloads, according to the available data) and Abstracts Views on Vision4Press platform.
Data correspond to usage on the plateform after 2015. The current usage metrics is available 48-96 hours after online publication and is updated daily on week days.
Initial download of the metrics may take a while.