Free Access
Fig. 10.
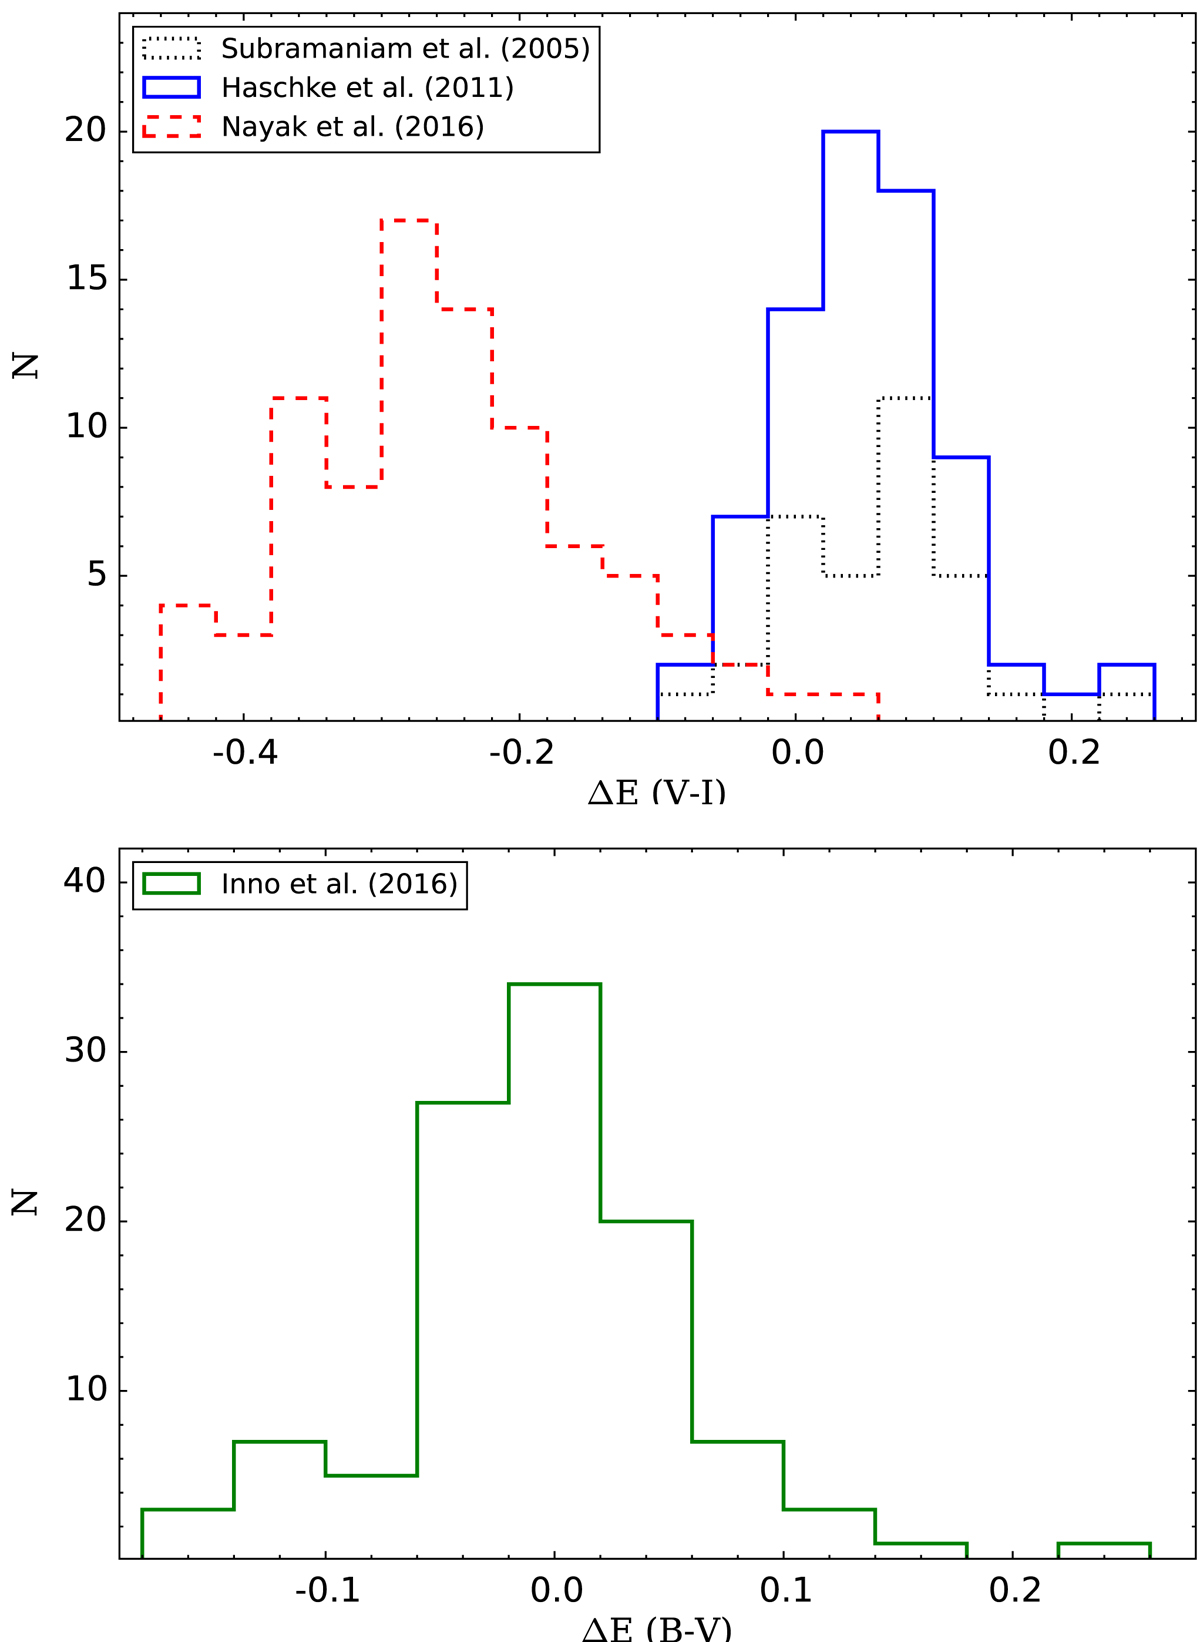
Upper panel: distribution of the ΔE(V − I), i.e. the results of past studies subtracted from our results in the LMC as mentioned in the top-left corner. Lower panel: difference ΔE(B − V) between our reddening estimates and those of Inno et al. (2016).
Current usage metrics show cumulative count of Article Views (full-text article views including HTML views, PDF and ePub downloads, according to the available data) and Abstracts Views on Vision4Press platform.
Data correspond to usage on the plateform after 2015. The current usage metrics is available 48-96 hours after online publication and is updated daily on week days.
Initial download of the metrics may take a while.