Fig. 9.
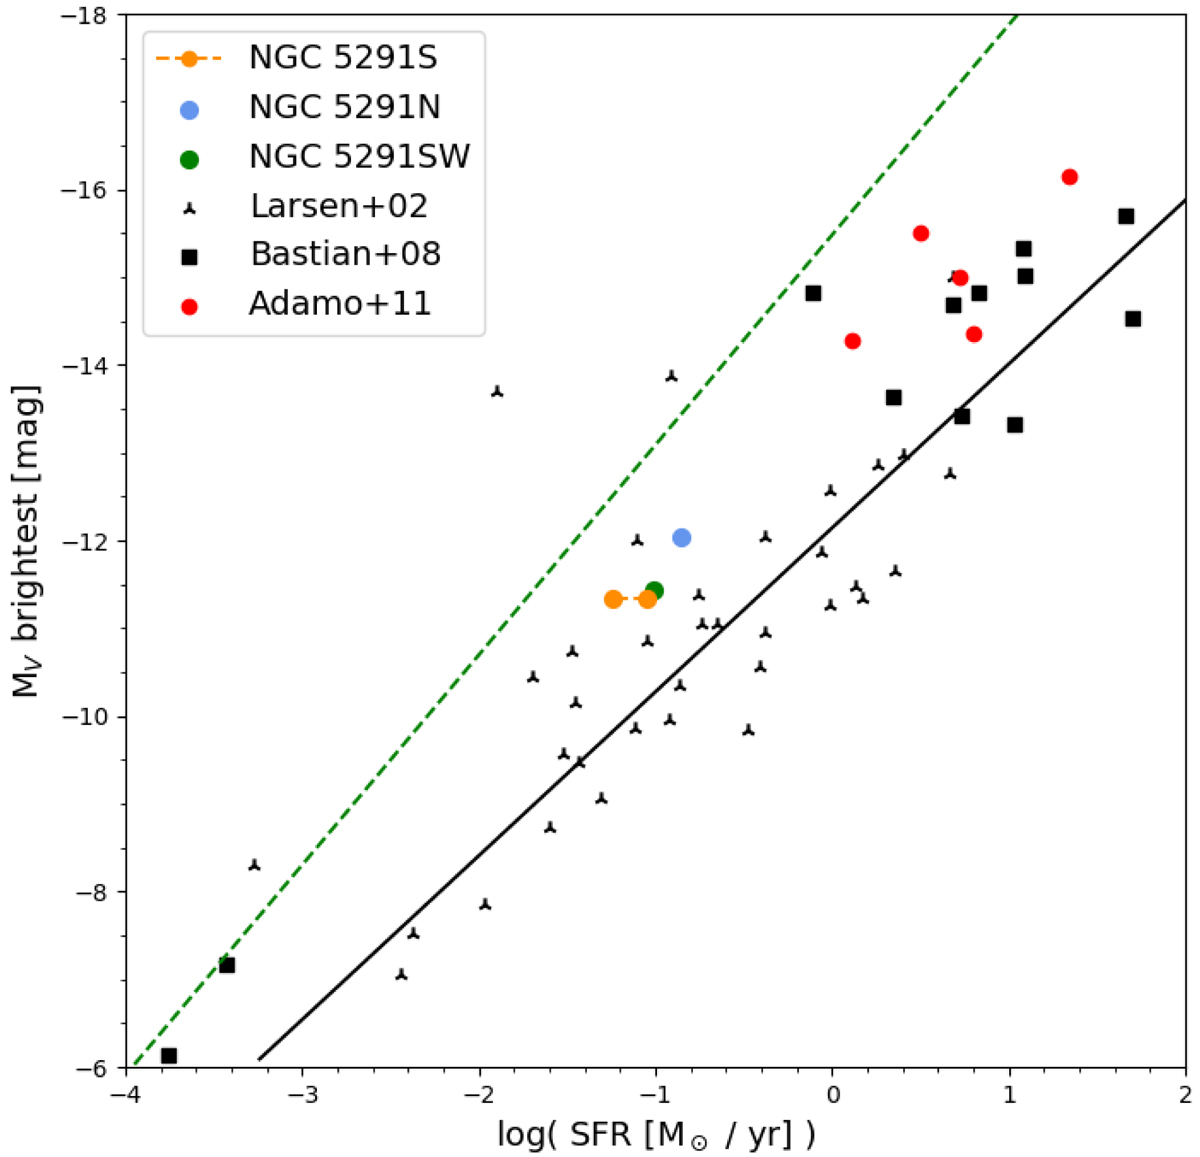
Brightest cluster MV–SFR relation for different galaxy samples. The NGC 5291S data point with the lowest SFR shows the value for S* only. The black line shows the fit of the Larsen (2002) sample. The dashed green line shows the maximum MV expected for a given SFR if all the star formation occurs in clusters with a ![]() power law (Bastian 2008).
power law (Bastian 2008).
Current usage metrics show cumulative count of Article Views (full-text article views including HTML views, PDF and ePub downloads, according to the available data) and Abstracts Views on Vision4Press platform.
Data correspond to usage on the plateform after 2015. The current usage metrics is available 48-96 hours after online publication and is updated daily on week days.
Initial download of the metrics may take a while.