Fig. 7.
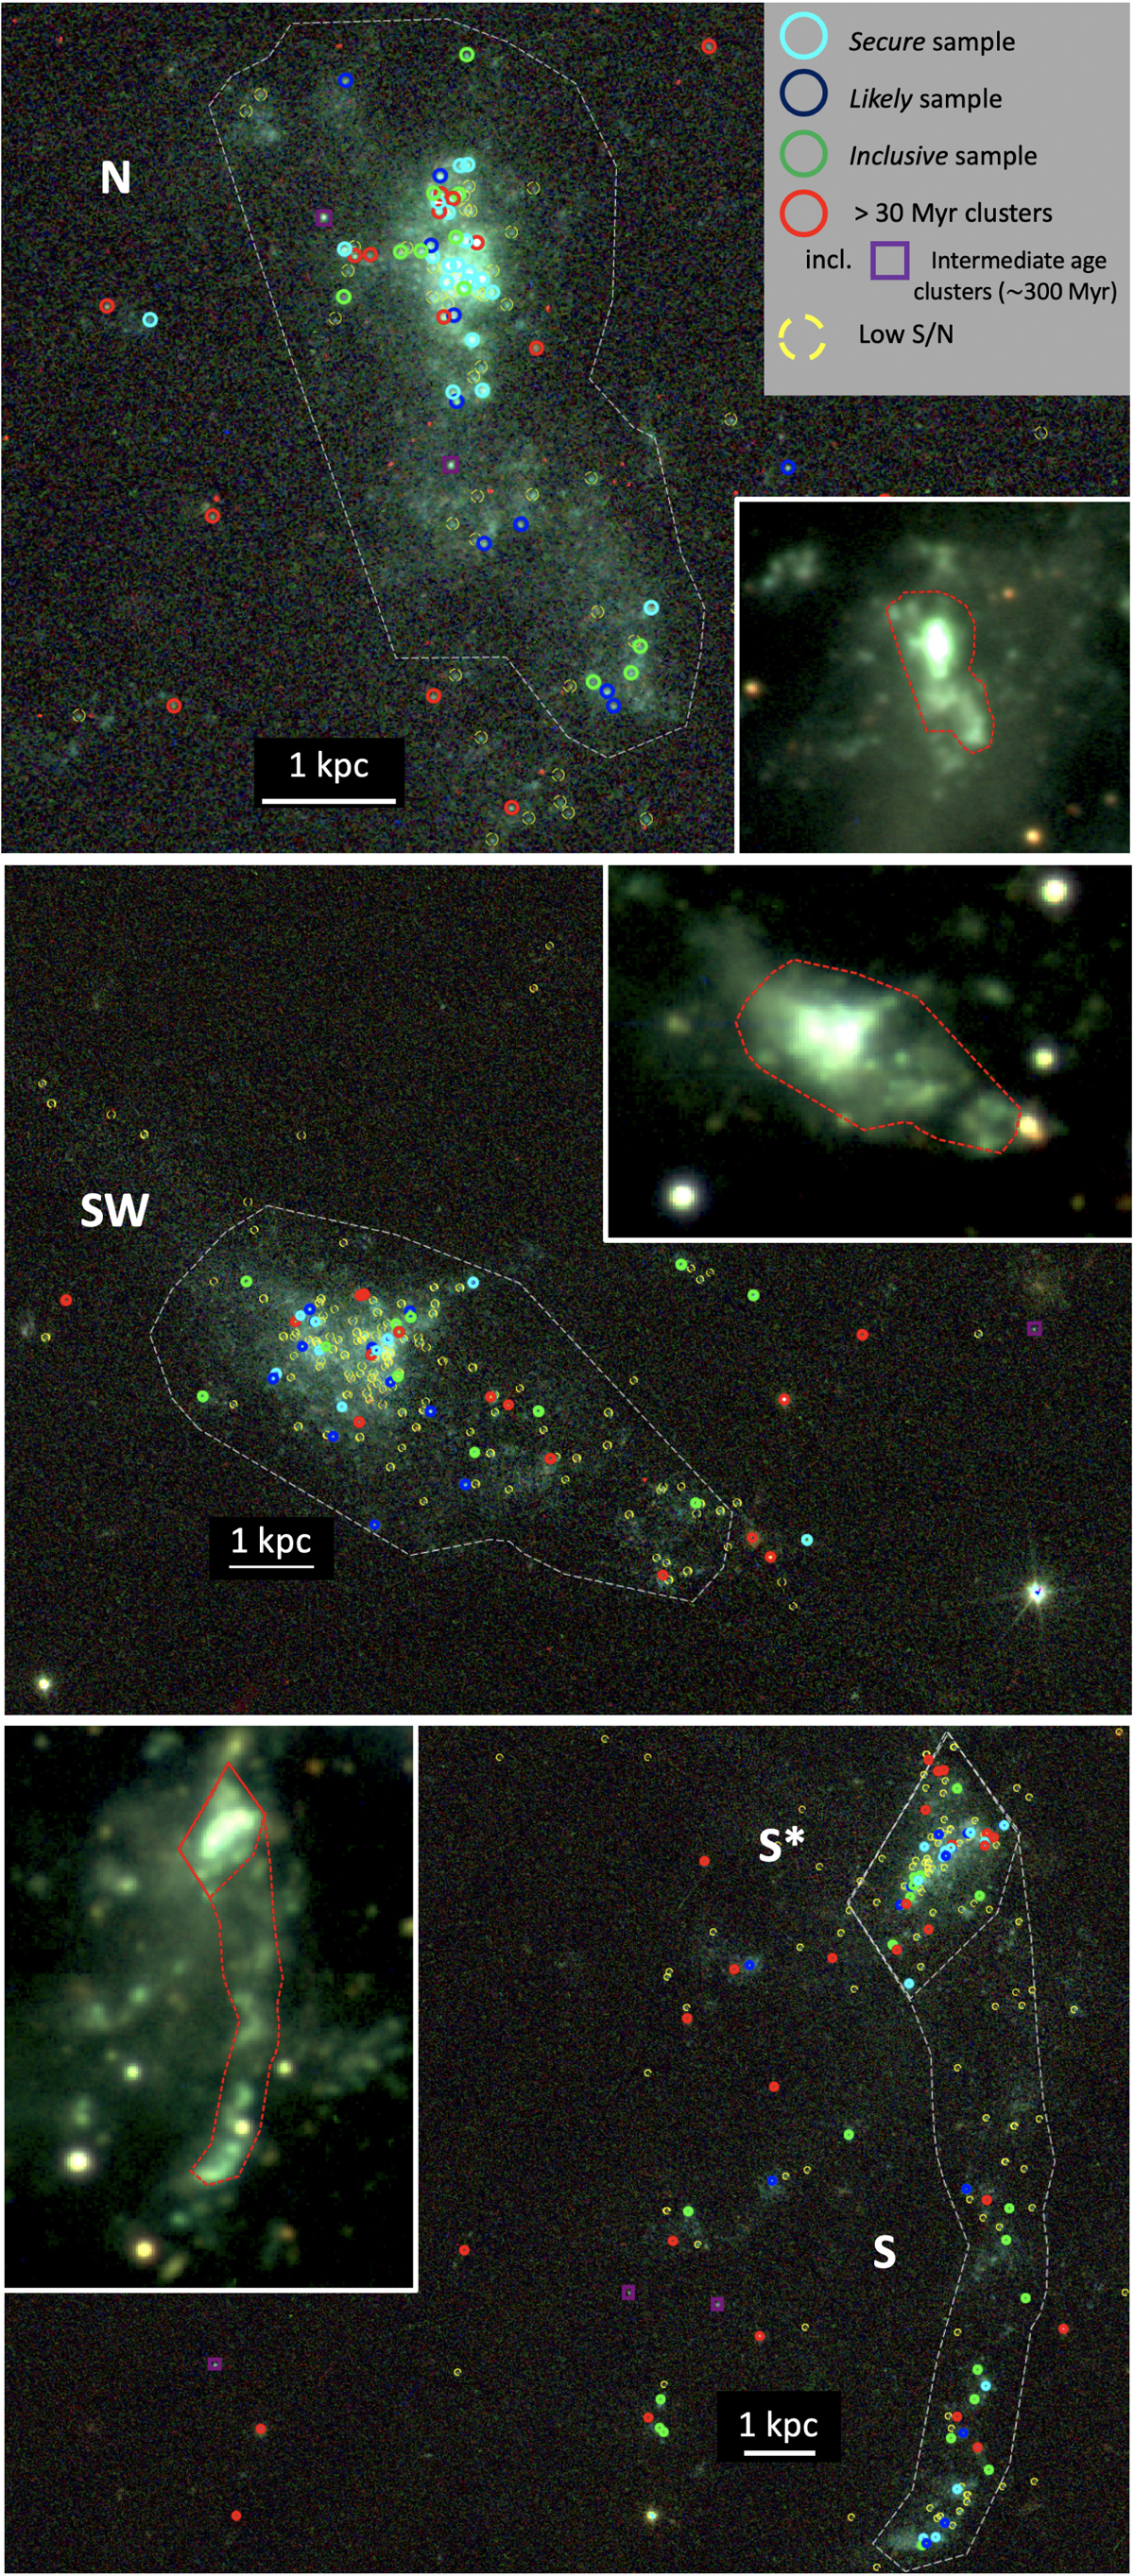
True-color image of the three TDGs: NGC 5291N (top panel), NGC 5291SW (middle panel), and NGC 5291S (bottom panel). The definitions of the young sample, degenerate clusters, and the sample older than 30 Myr are given in the text. The intermediate clusters are part of the sample older than 30 Myr and are discussed in Sect. 4.6. We also show detected clusters that do not have S/N > 3 in at least four bands as the low S/N sample. The dashed white contours show the area considered to compute ΣSFR. Bottom panel: two contours that are explained in the text. The inset shows a VRI image from FORS (Fensch et al. 2016), with the same contours. Only clusters inside the white contours are considered for the computation of the CFE.
Current usage metrics show cumulative count of Article Views (full-text article views including HTML views, PDF and ePub downloads, according to the available data) and Abstracts Views on Vision4Press platform.
Data correspond to usage on the plateform after 2015. The current usage metrics is available 48-96 hours after online publication and is updated daily on week days.
Initial download of the metrics may take a while.