Fig. 4.
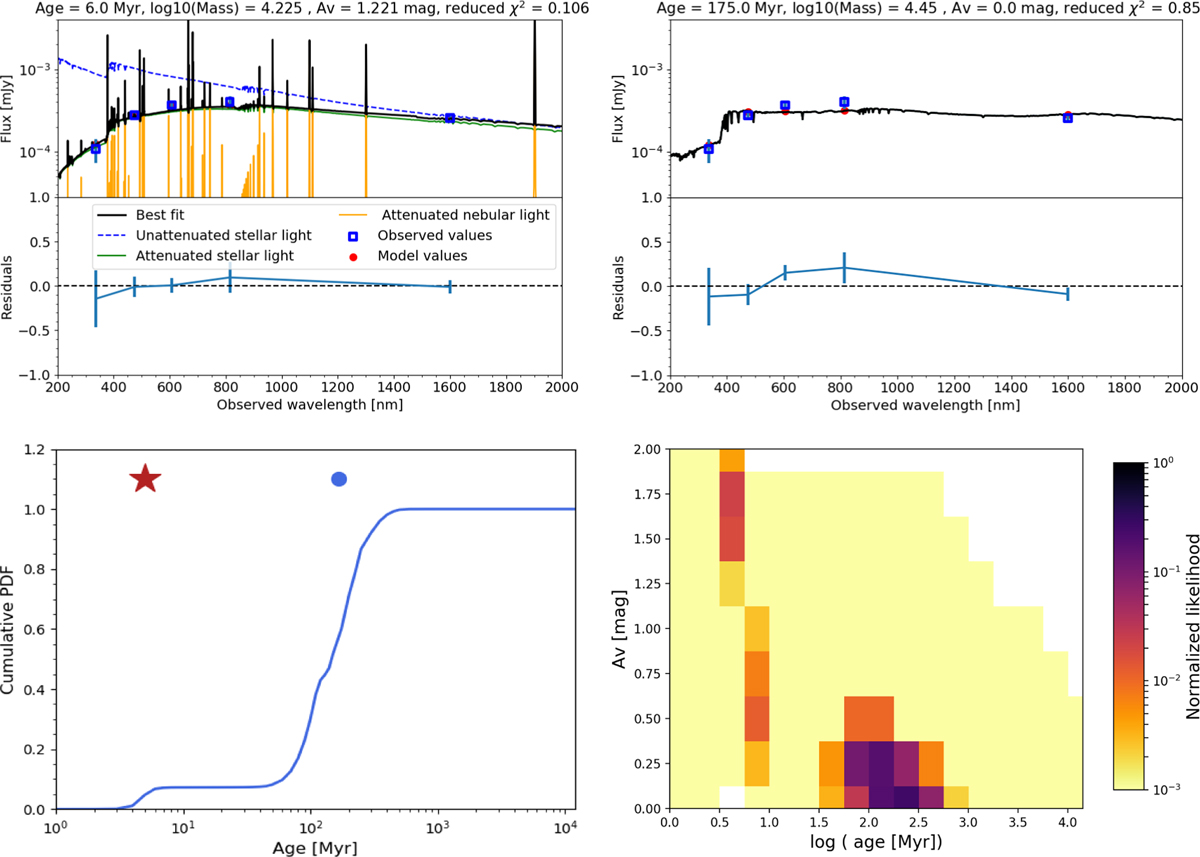
Top left: example of the best fit for one cluster candidate. The retrieved physical parameters and the reduced χ2 are given at the top of the plot. Top right: best fit for the same cluster candidate when AV = 0 mag is imposed. Bottom left: cumulative age PDF for the cluster. The star shows the best-fitting age. The blue dot shows the output value of CIGALE. Bottom right: normalized likelihood distribution for age and extinction for the given cluster candidate.
Current usage metrics show cumulative count of Article Views (full-text article views including HTML views, PDF and ePub downloads, according to the available data) and Abstracts Views on Vision4Press platform.
Data correspond to usage on the plateform after 2015. The current usage metrics is available 48-96 hours after online publication and is updated daily on week days.
Initial download of the metrics may take a while.