Fig. 2.
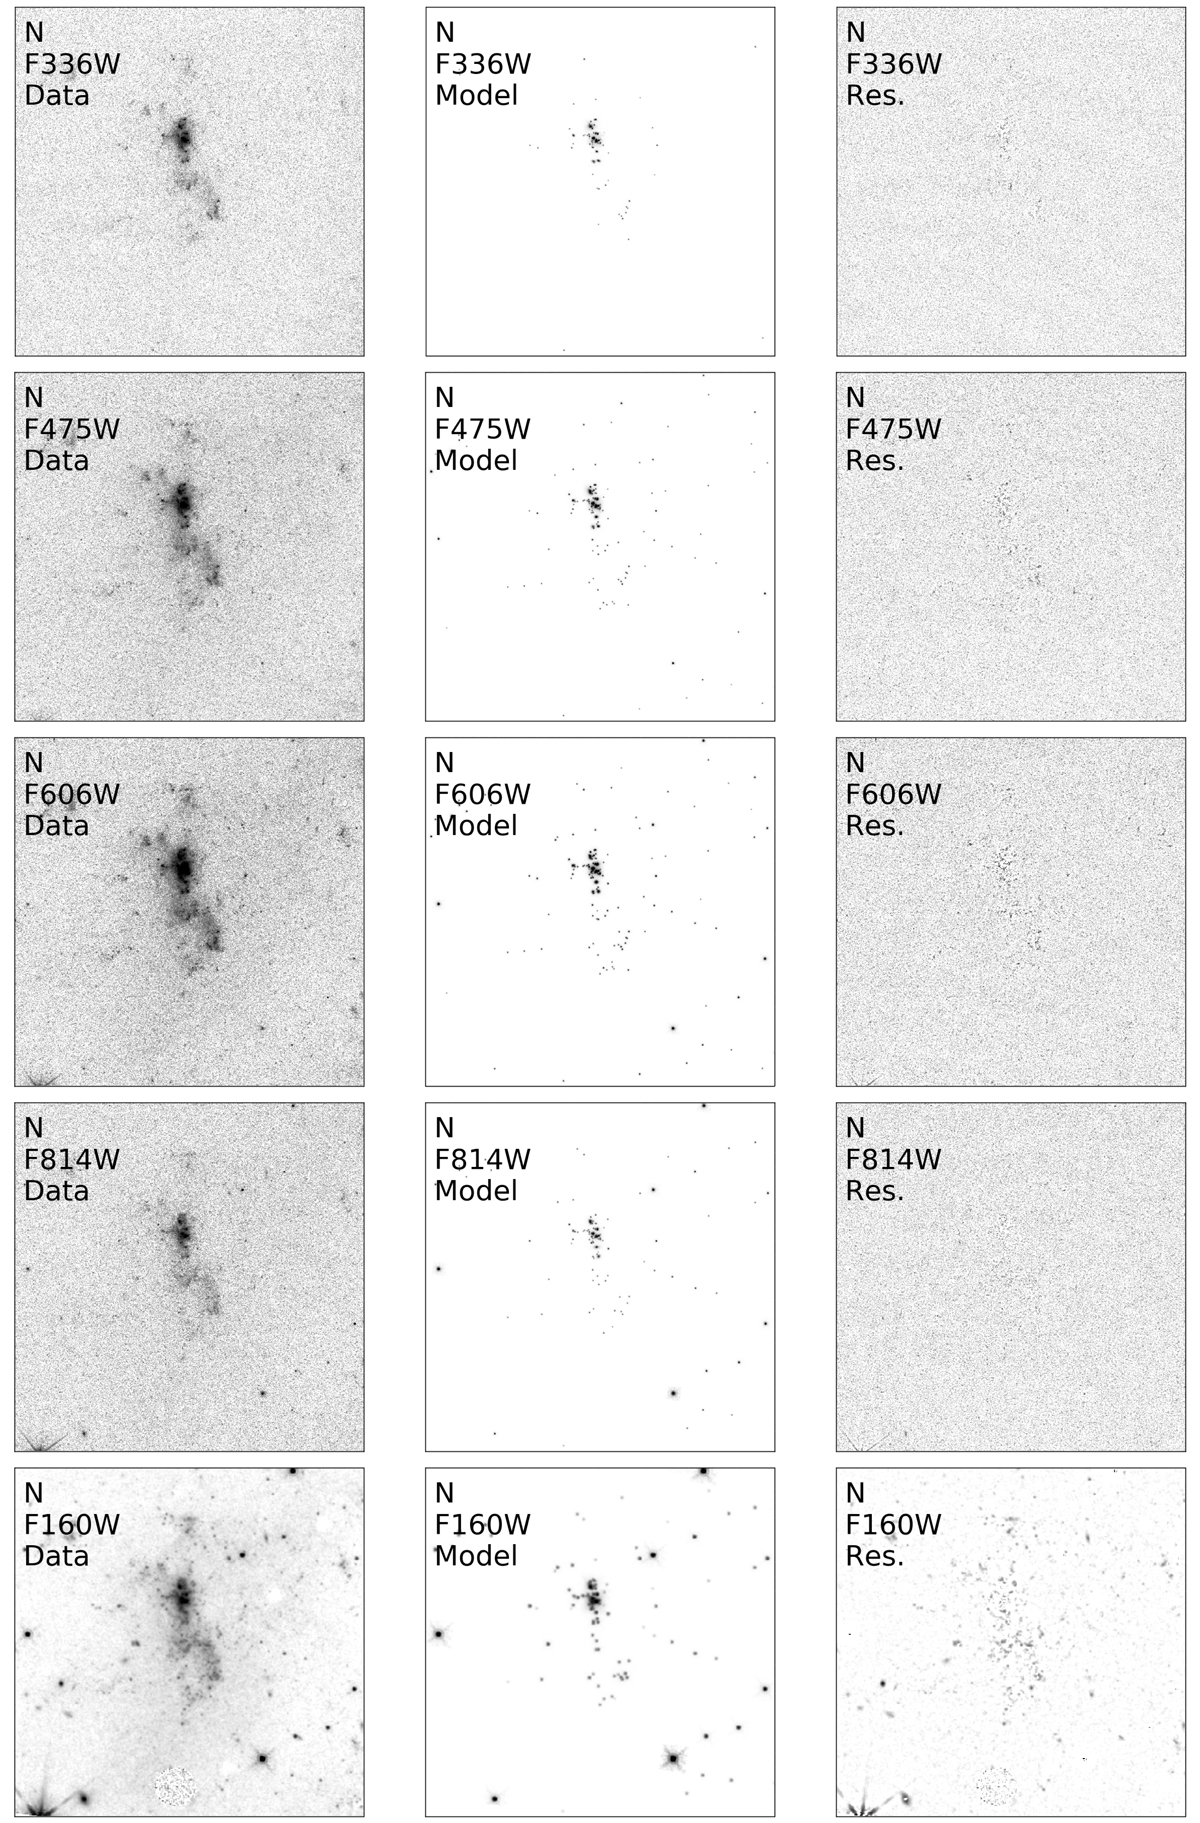
Data, model, and residual images for the TDG N. The two other TDGs are shown in Appendix A. For each filter we show the data in the left column, the cluster model in the middle column, and the background-subtracted residuals in the right column. From top to bottom: F336W, F475W, F606W, F814W, and F160W. We used the L.A. Cosmics algorithm (van Dokkum 2001) to remove the cosmic rays. North is up and east is to the left. The field of view covers 14.4 kpc × 14.4 kpc.
Current usage metrics show cumulative count of Article Views (full-text article views including HTML views, PDF and ePub downloads, according to the available data) and Abstracts Views on Vision4Press platform.
Data correspond to usage on the plateform after 2015. The current usage metrics is available 48-96 hours after online publication and is updated daily on week days.
Initial download of the metrics may take a while.