Fig. 12.
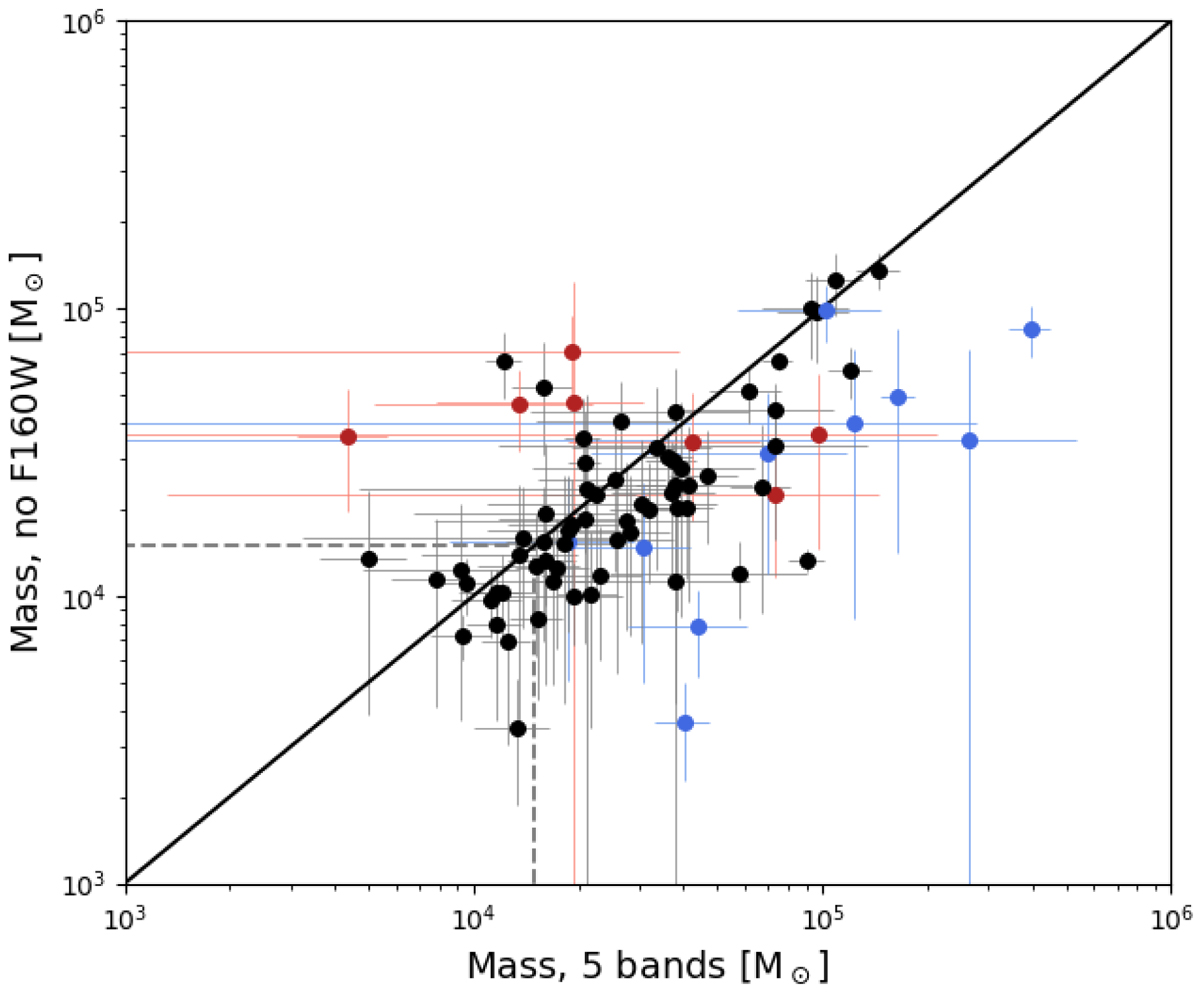
Comparison between the mass estimation between the analysis including or excluding the F160W band. The blue points show clusters that are included as younger than 30 Myr only in the analysis without F160W. The red points show clusters that are included in this category only when the F160W band is included. The thick line shows the identity function. The two dashed lines show the mass completeness limit.
Current usage metrics show cumulative count of Article Views (full-text article views including HTML views, PDF and ePub downloads, according to the available data) and Abstracts Views on Vision4Press platform.
Data correspond to usage on the plateform after 2015. The current usage metrics is available 48-96 hours after online publication and is updated daily on week days.
Initial download of the metrics may take a while.