Fig. 10.
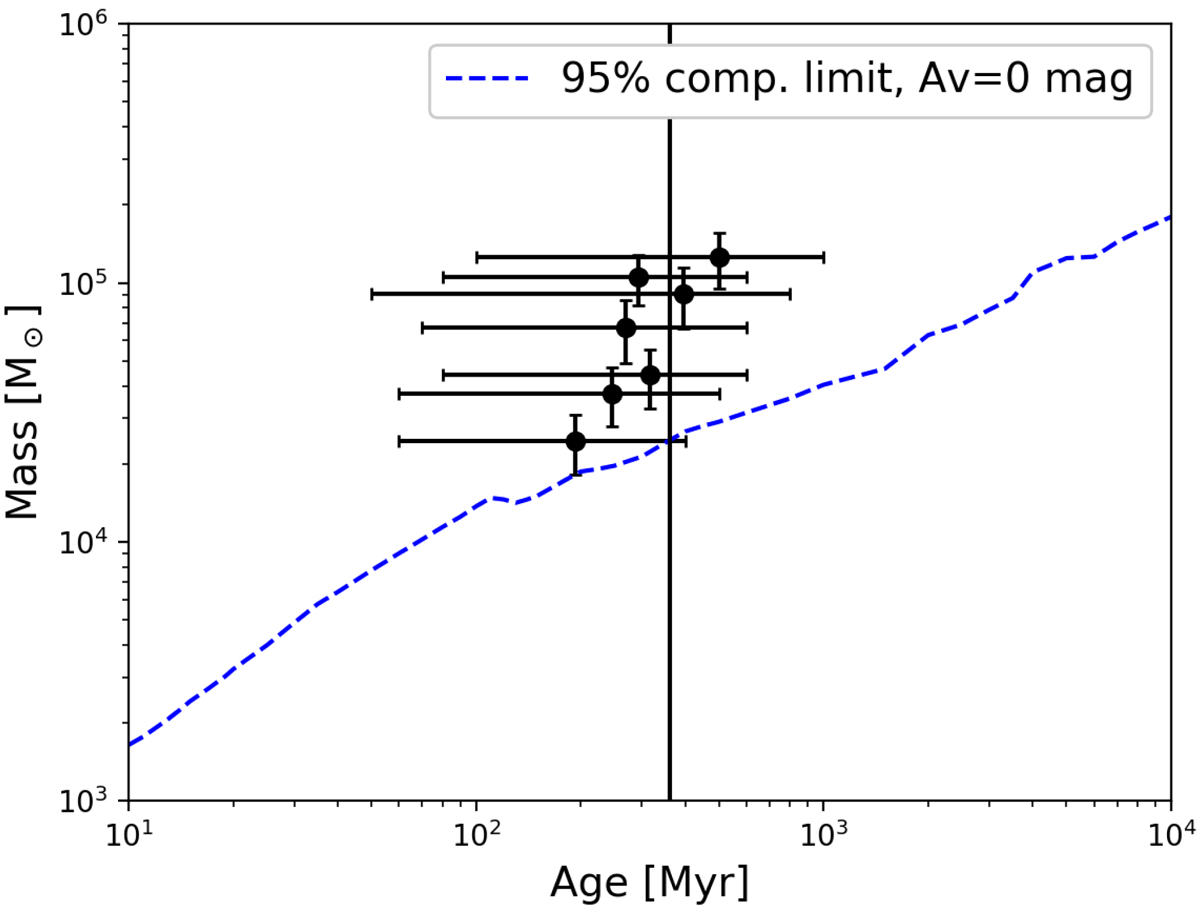
Masses and ages of our conservative sample of intermediate-age star clusters. The x-axis error bar shows the width between the first and last decile of the age PDF. The y-axis error bar shows the standard deviation for the mass estimate. The vertical black line shows the formation time of the ring structure, ∼360 Myr, as determined by Bournaud et al. (2007).
Current usage metrics show cumulative count of Article Views (full-text article views including HTML views, PDF and ePub downloads, according to the available data) and Abstracts Views on Vision4Press platform.
Data correspond to usage on the plateform after 2015. The current usage metrics is available 48-96 hours after online publication and is updated daily on week days.
Initial download of the metrics may take a while.