Fig. 1.
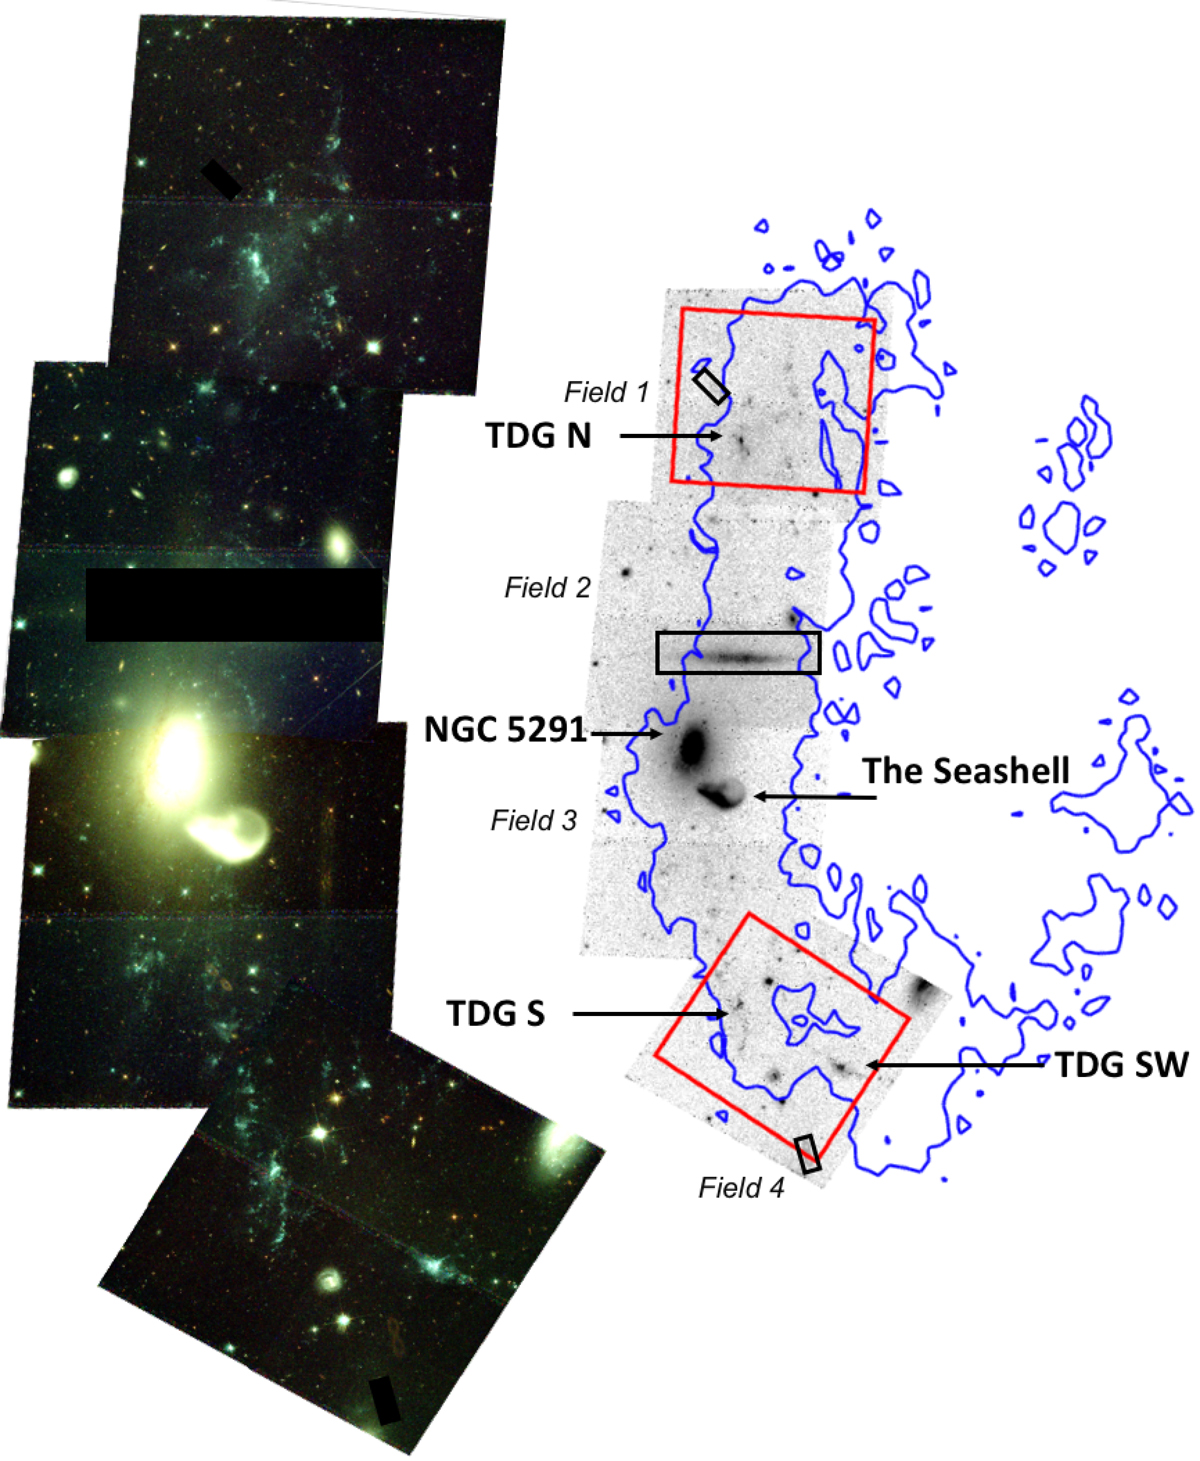
Left: composite-color HST image of the system using the F475W (blue), F606W (green), and F814W (red) filters. North is up and east is to the left. Each field of view is 49.55 kpc × 53.34 kpc. Three regions contaminated by strong artifacts were masked. They are shown with black rectangles in the right image. Right: F475W image. The blue contour encircles regions where the HI column density is higher than 1020 NHI cm−2 (VLA data, Bournaud et al. 2007). The two F160W-band fields of view are shown by the red rectangles. The central galaxy NGC 5291, the Seashell, and the three TDGs (N, S, and SW) are indicated by black arrows.
Current usage metrics show cumulative count of Article Views (full-text article views including HTML views, PDF and ePub downloads, according to the available data) and Abstracts Views on Vision4Press platform.
Data correspond to usage on the plateform after 2015. The current usage metrics is available 48-96 hours after online publication and is updated daily on week days.
Initial download of the metrics may take a while.