Fig. 7
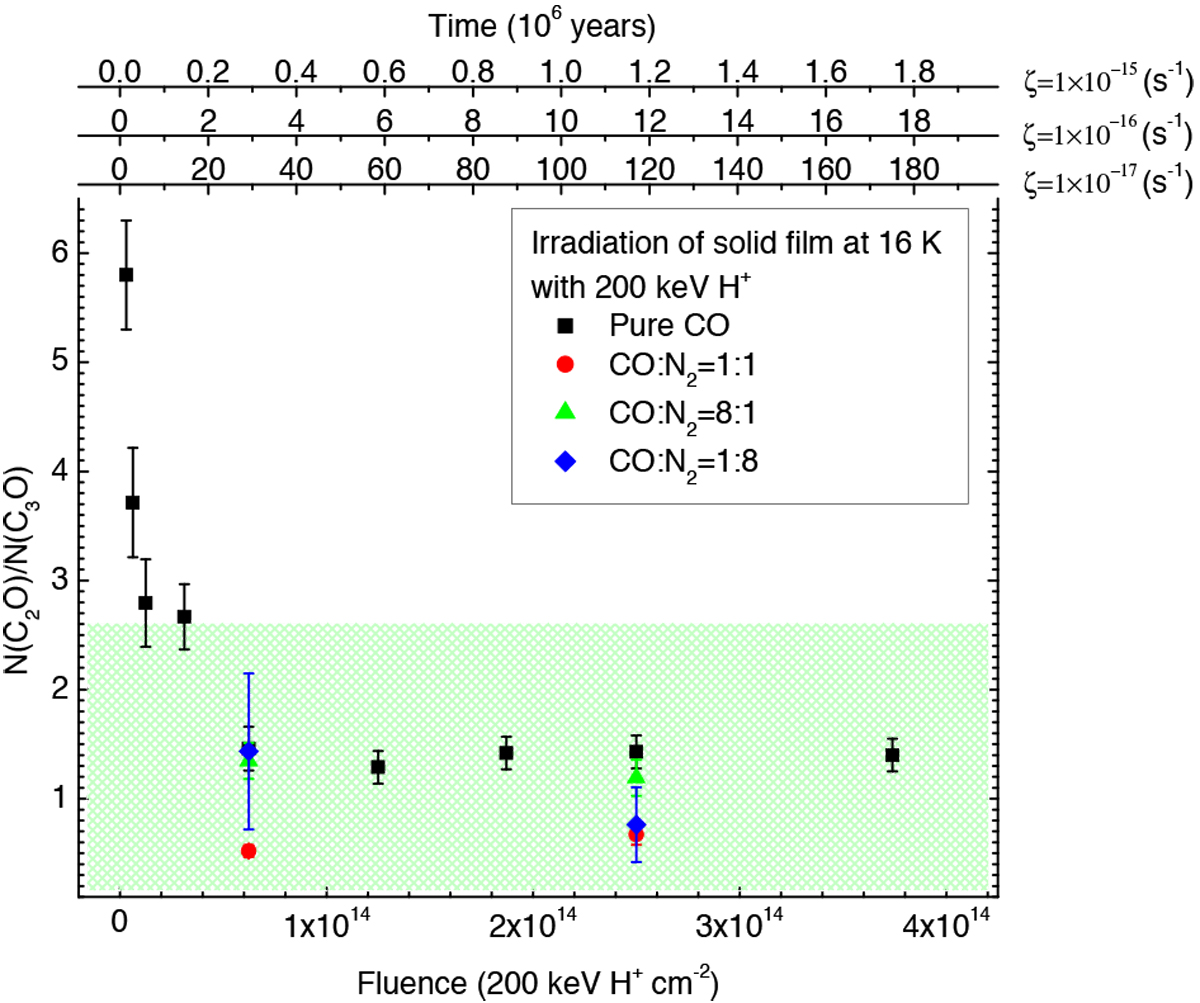
C2O/C3O ratio as a function of fluence (ions cm−2, bottom x-axis) obtained after ion irradiation of pure CO (black squares), CO:N2 = 1:1 mixture (redcircles), CO:N2 = 8:1 (green triangles) and CO:N2 = 1:8 (blue rhombus). Top x-axes give an estimate of the time (in 106 yr) necessary for interstellar ices to undergo the effects observed in the laboratory. Values of cosmic-ray ionization rate used to calculate timescales are reported near each x-axis in the figure. The green box represents the range of observed C2O/C3O ratios in star-forming regions (including the errors. Ratios are given in Table 1.
Current usage metrics show cumulative count of Article Views (full-text article views including HTML views, PDF and ePub downloads, according to the available data) and Abstracts Views on Vision4Press platform.
Data correspond to usage on the plateform after 2015. The current usage metrics is available 48-96 hours after online publication and is updated daily on week days.
Initial download of the metrics may take a while.