Fig. 3
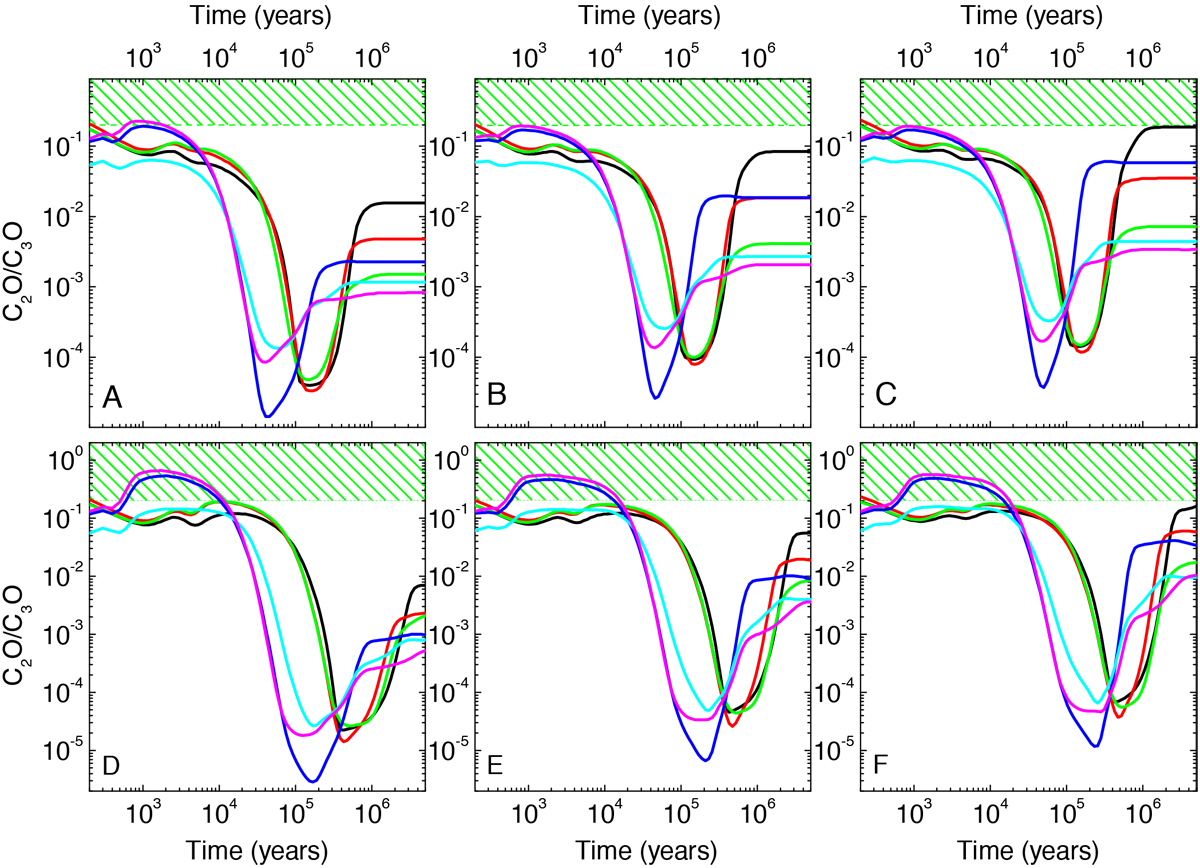
C2O/C3O ratios as a function of time (in years) for ζ = 1 × 10⁻¹⁶ s−1 (top panels, A, B, and C) and for ζ = 1 × 10⁻¹⁷ s−1 (bottom panels, D, E, and F). Panels A and D: 10 K; panels B and E: 20 K; panels C and F: 30 K. The modelwas run for different C/O initial ratios and hydrogen number density. The green boxes represent the lower range of observed ratios (including the errors, see Table 1). Black line: C/O = 0.4, nH = 2 × 104 cm−3; red line: C/O = 0.8, nH = 2 × 104 cm−3; green line: C/O = 0.65, nH = 2 × 104 cm−3; blue line: C/O = 0.65, nH = 2 × 105 cm−3; cyan line: C/O = 0.8, nH = 2 × 105 cm−3; magenta line: C/O = 0.9, nH = 2 × 105 cm−3.
Current usage metrics show cumulative count of Article Views (full-text article views including HTML views, PDF and ePub downloads, according to the available data) and Abstracts Views on Vision4Press platform.
Data correspond to usage on the plateform after 2015. The current usage metrics is available 48-96 hours after online publication and is updated daily on week days.
Initial download of the metrics may take a while.