Fig. 8
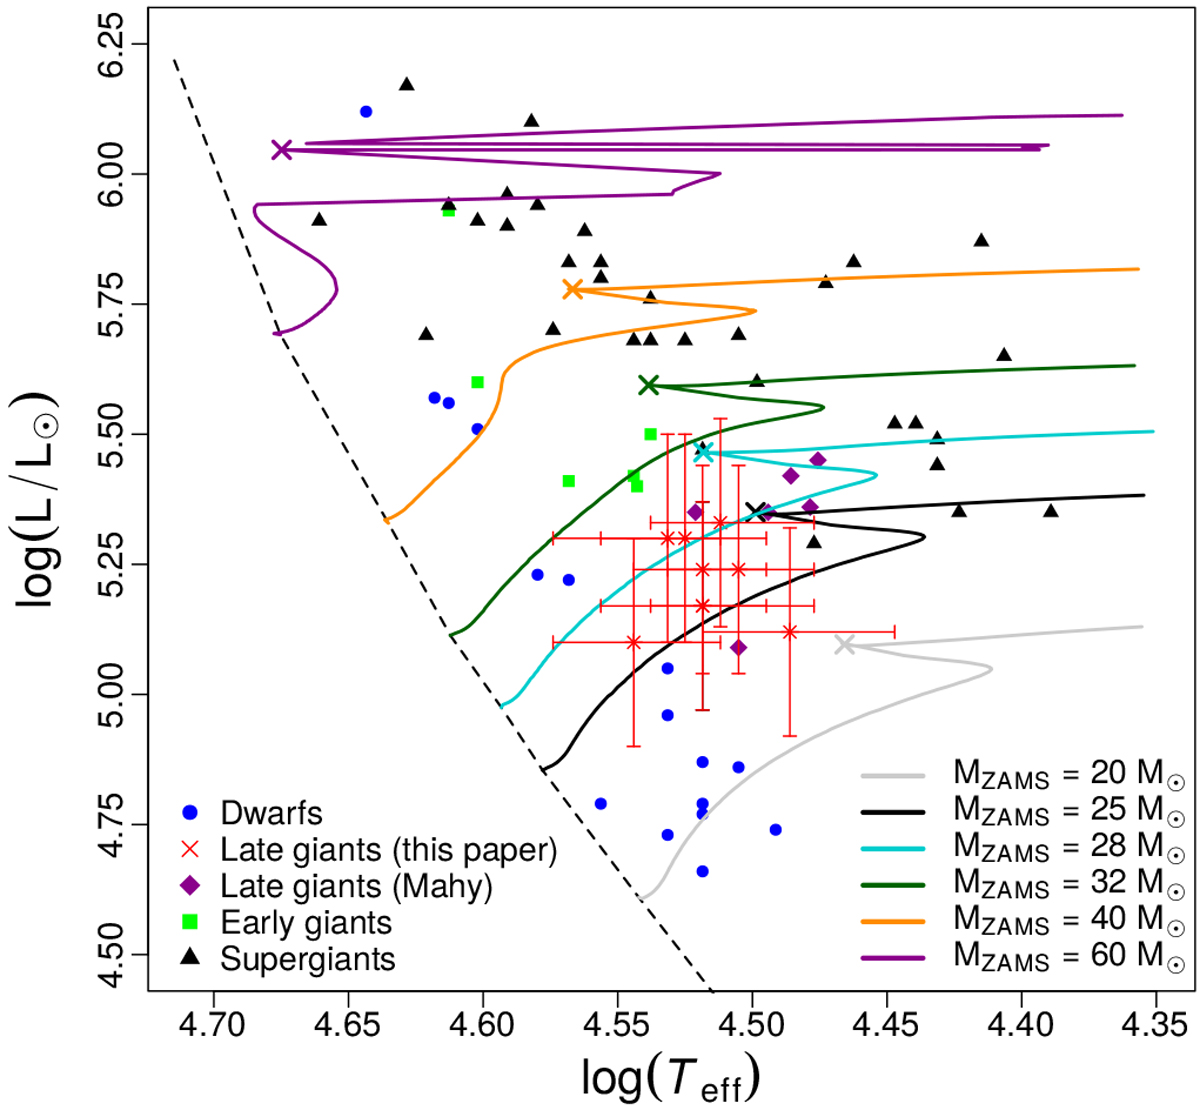
Evolutionary tracks (in color lines) for samples of O dwarfs, giants, and supergiants. For each model, the central H exhaustion is indicated by crosses. The zero-age line is in dashed black. Stars are grouped by different symbols and colors. Our sample (red crosses) has initial masses (MZAMS) ranging around 25–28 M⊙. Late O giants are closer to the end of the main sequence phase than the dwarfs.
Current usage metrics show cumulative count of Article Views (full-text article views including HTML views, PDF and ePub downloads, according to the available data) and Abstracts Views on Vision4Press platform.
Data correspond to usage on the plateform after 2015. The current usage metrics is available 48-96 hours after online publication and is updated daily on week days.
Initial download of the metrics may take a while.