Fig. 7
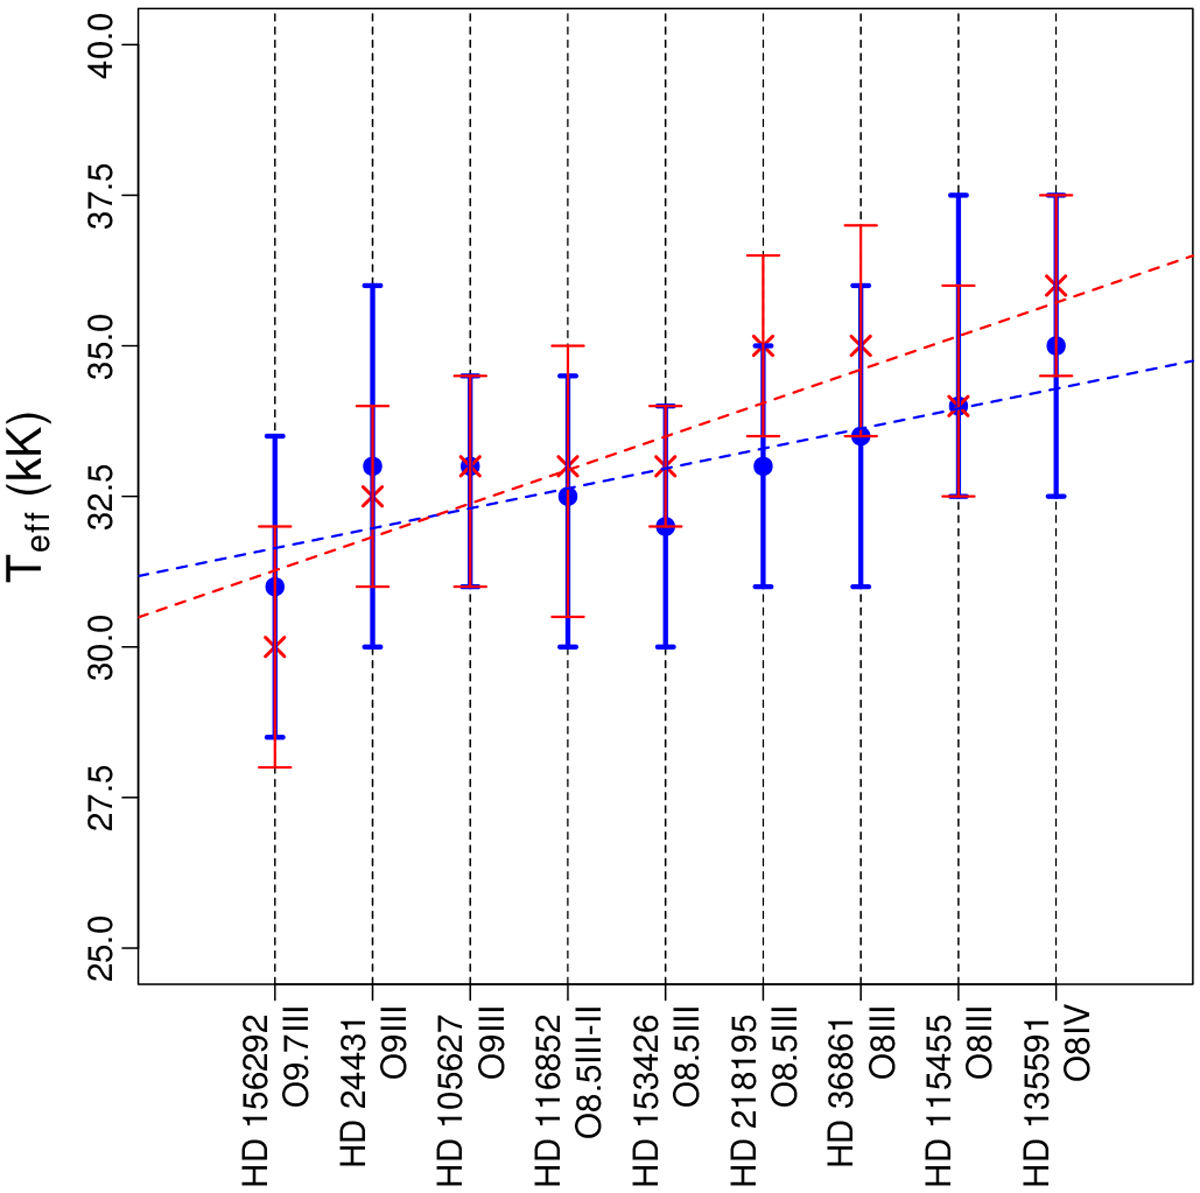
Comparison between effective temperatures obtained from the UV versus optical for all our sample. The stars are ordered from the later to the earlier types. The effective temperature derived from the UV and the optical regions are shown, respectively, by circles (blue) and crosses (red). We show weighted least squares fits to the UV Teff (dashed blueline) and to the optical Teff (dashed red line). We note the good agreement between them and the trend of higher Teff towards earlier spectral types.
Current usage metrics show cumulative count of Article Views (full-text article views including HTML views, PDF and ePub downloads, according to the available data) and Abstracts Views on Vision4Press platform.
Data correspond to usage on the plateform after 2015. The current usage metrics is available 48-96 hours after online publication and is updated daily on week days.
Initial download of the metrics may take a while.