Fig. 5
Effect of ![]() in the Teff
analysis (HD 116852). Models with
in the Teff
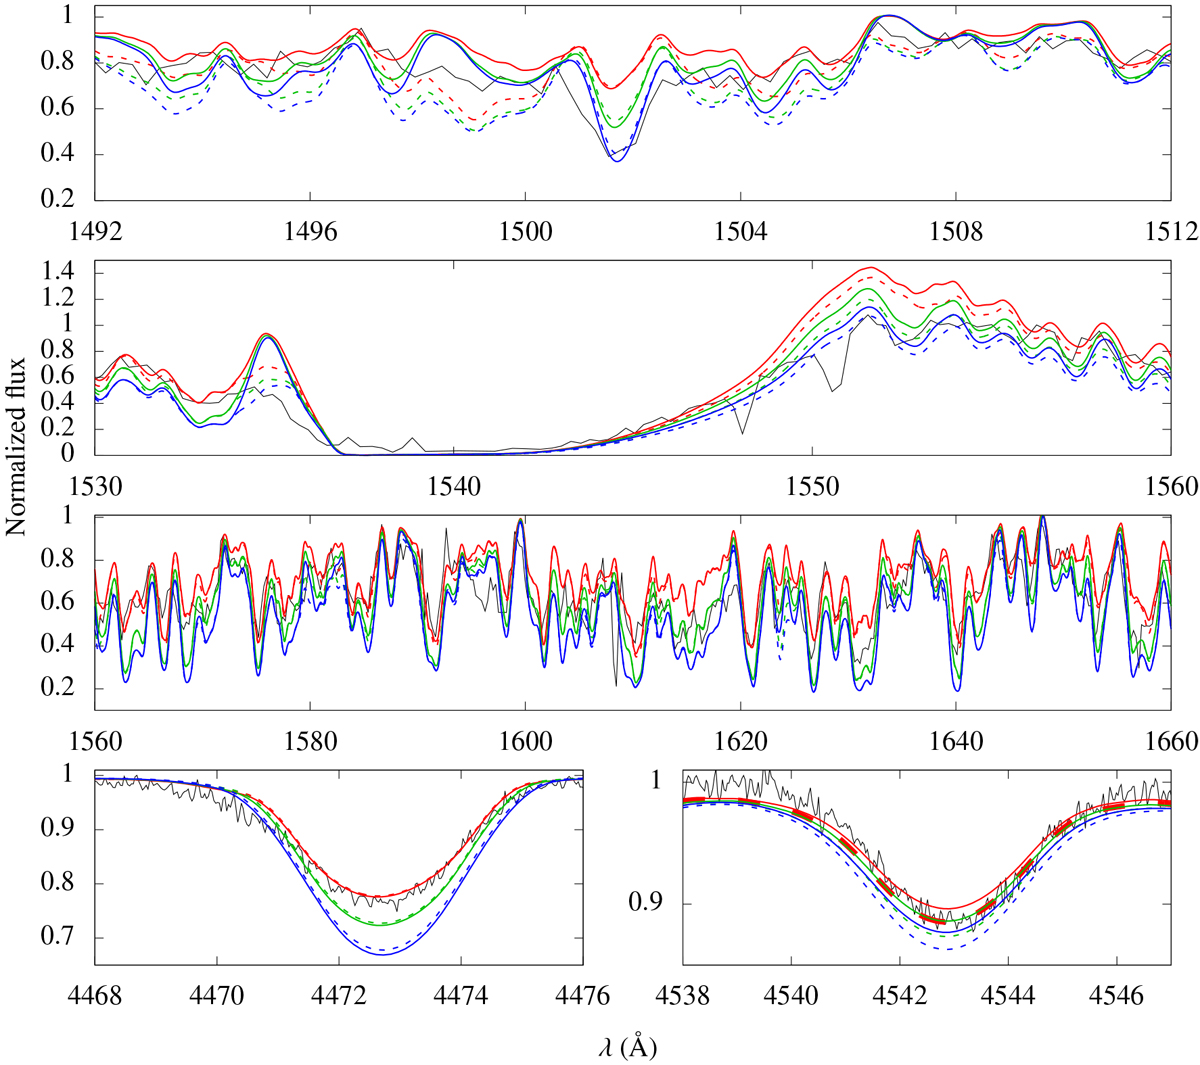
analysis (HD 116852). Models with ![]() = 10, 20, and 30 km s−1 are shown respectively in red, green, and blue. The IUE and FEROS data are shown in black. Models with a fuller account of atomic species are shown by dashed lines. The model with
= 10, 20, and 30 km s−1 are shown respectively in red, green, and blue. The IUE and FEROS data are shown in black. Models with a fuller account of atomic species are shown by dashed lines. The model with
![]() = 10 km s−1 and a fuller account of species (dashed red line) is shown with thicker lines in He II λ4542 since it is overlapped with the basic model
= 10 km s−1 and a fuller account of species (dashed red line) is shown with thicker lines in He II λ4542 since it is overlapped with the basic model ![]() = 20 km s−1
(solid green). Line S V λ1502 is reproduced by our model with the highest photospheric microturbulence velocity. The emission component of C IV
λλ1548,1551 is also betterreproduced with a higher
= 20 km s−1
(solid green). Line S V λ1502 is reproduced by our model with the highest photospheric microturbulence velocity. The emission component of C IV
λλ1548,1551 is also betterreproduced with a higher ![]() up to 20–30 km s−1. However, Teff
diagnostics are misfitted in this case. It is not possible to fit simultaneously He I
λ4471 and He II λ4542 considering
up to 20–30 km s−1. However, Teff
diagnostics are misfitted in this case. It is not possible to fit simultaneously He I
λ4471 and He II λ4542 considering ![]() = 20–30 km s−1. Our conclusions are unchanged regardless of the improved atomic in the modeling.
= 20–30 km s−1. Our conclusions are unchanged regardless of the improved atomic in the modeling.
Current usage metrics show cumulative count of Article Views (full-text article views including HTML views, PDF and ePub downloads, according to the available data) and Abstracts Views on Vision4Press platform.
Data correspond to usage on the plateform after 2015. The current usage metrics is available 48-96 hours after online publication and is updated daily on week days.
Initial download of the metrics may take a while.