Fig. 23
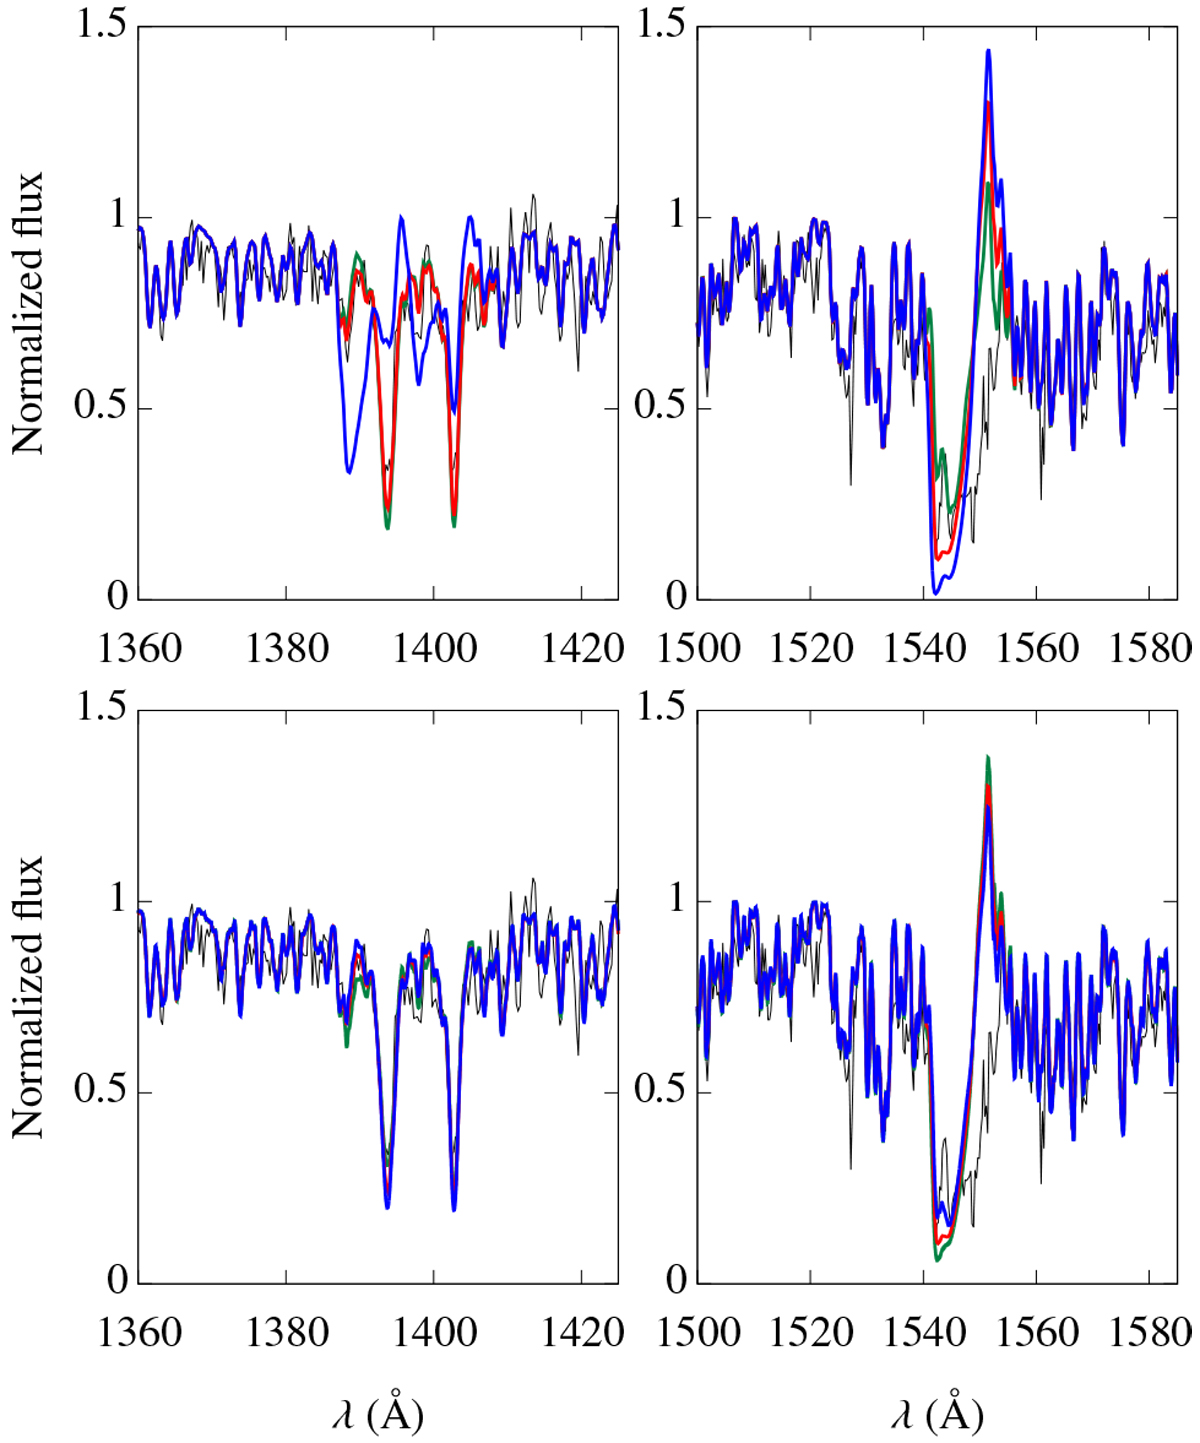
Same analysis as in Fig. 22, but for HD 156292. Final model (red) with Ṁ = 1.5 × 10⁻⁹M⊙ yr−1 and log (L⋆ ∕ L⊙) = 5.12. Top panel: models with the limits on Ṁ (7.5 × 10⁻¹⁰M⊙ yr−1 in green and 5.5 × 10⁻⁹M⊙ yr−1 in blue): fixed log (L⋆ ∕ L⊙) = 5.12. Bottom panel: models with the limits on log (L⋆ ∕ L⊙) (4.92 in green and 5.32 in blue): fixed Ṁ = 1.5 × 10⁻⁹M⊙ yr−1. We note that the error bars of log (L⋆ ∕ L⊙) do not produce any significant changes on the UV diagnostics for Ṁ.
Current usage metrics show cumulative count of Article Views (full-text article views including HTML views, PDF and ePub downloads, according to the available data) and Abstracts Views on Vision4Press platform.
Data correspond to usage on the plateform after 2015. The current usage metrics is available 48-96 hours after online publication and is updated daily on week days.
Initial download of the metrics may take a while.