Fig. 19
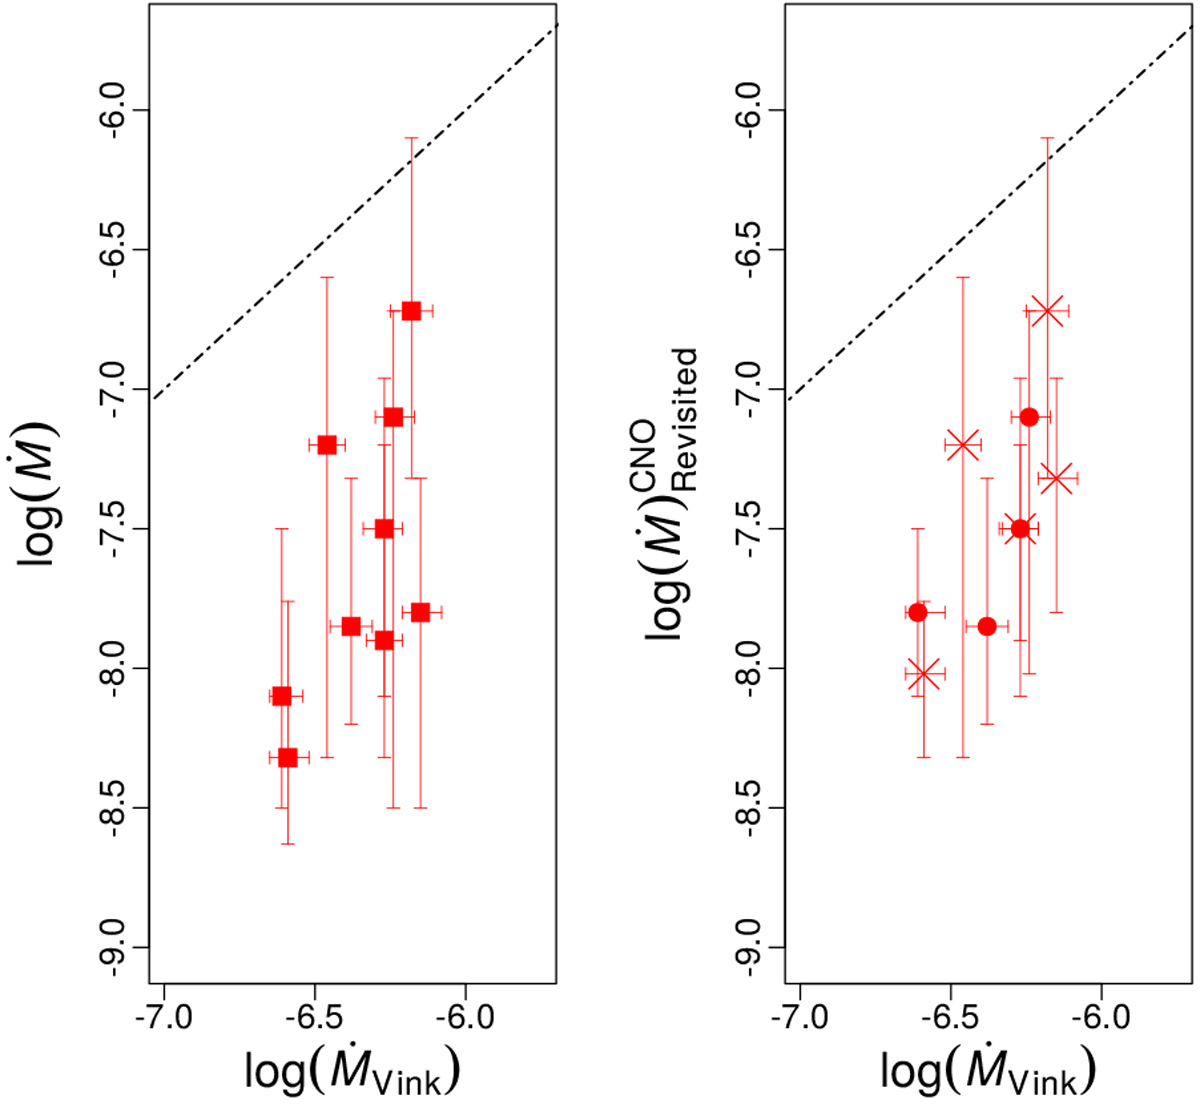
Effects of ɛCNO in the log (Ṁ) versus log (ṀVink) diagram. On the left are previous results using the solar chemical abundance (shown in Fig. 12). On the right are revised Ṁ taking different CNO values into account. Circles indicate stars with exact ɛCNO from Martins et al. (2015a). Crosses indicate stars for which we adopted extreme ɛCNO based on the results of Martins et al. (2015a). Our conclusions about weak wind in late O giants are not affected due to CNO abundances.
Current usage metrics show cumulative count of Article Views (full-text article views including HTML views, PDF and ePub downloads, according to the available data) and Abstracts Views on Vision4Press platform.
Data correspond to usage on the plateform after 2015. The current usage metrics is available 48-96 hours after online publication and is updated daily on week days.
Initial download of the metrics may take a while.