Fig. 18
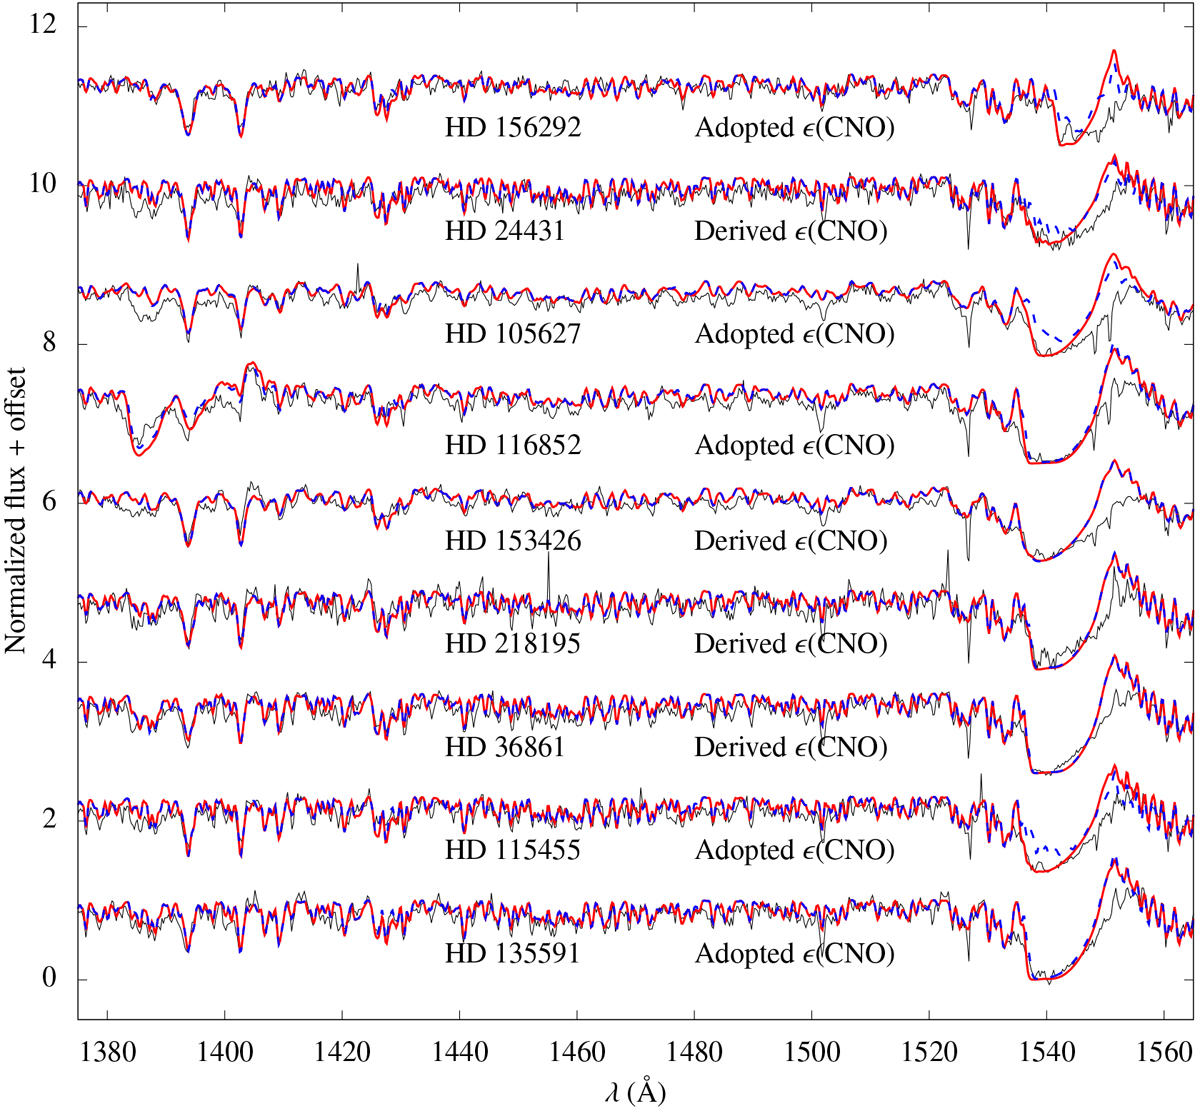
Final models for all our sample considering solar abundances (red). Re-computed models using ɛCNO from Martins et al. (2015a) are in dashed blue. IUE data are in black. We indicate, right above each spectrum, whether ɛCNO is a determination from Martins et al. (2015a) or an adoption based on their results (see text for details). We note that the highest effects in C IV λλ1548,1551 are due to the adopted ɛCNO.
Current usage metrics show cumulative count of Article Views (full-text article views including HTML views, PDF and ePub downloads, according to the available data) and Abstracts Views on Vision4Press platform.
Data correspond to usage on the plateform after 2015. The current usage metrics is available 48-96 hours after online publication and is updated daily on week days.
Initial download of the metrics may take a while.