Fig. 17
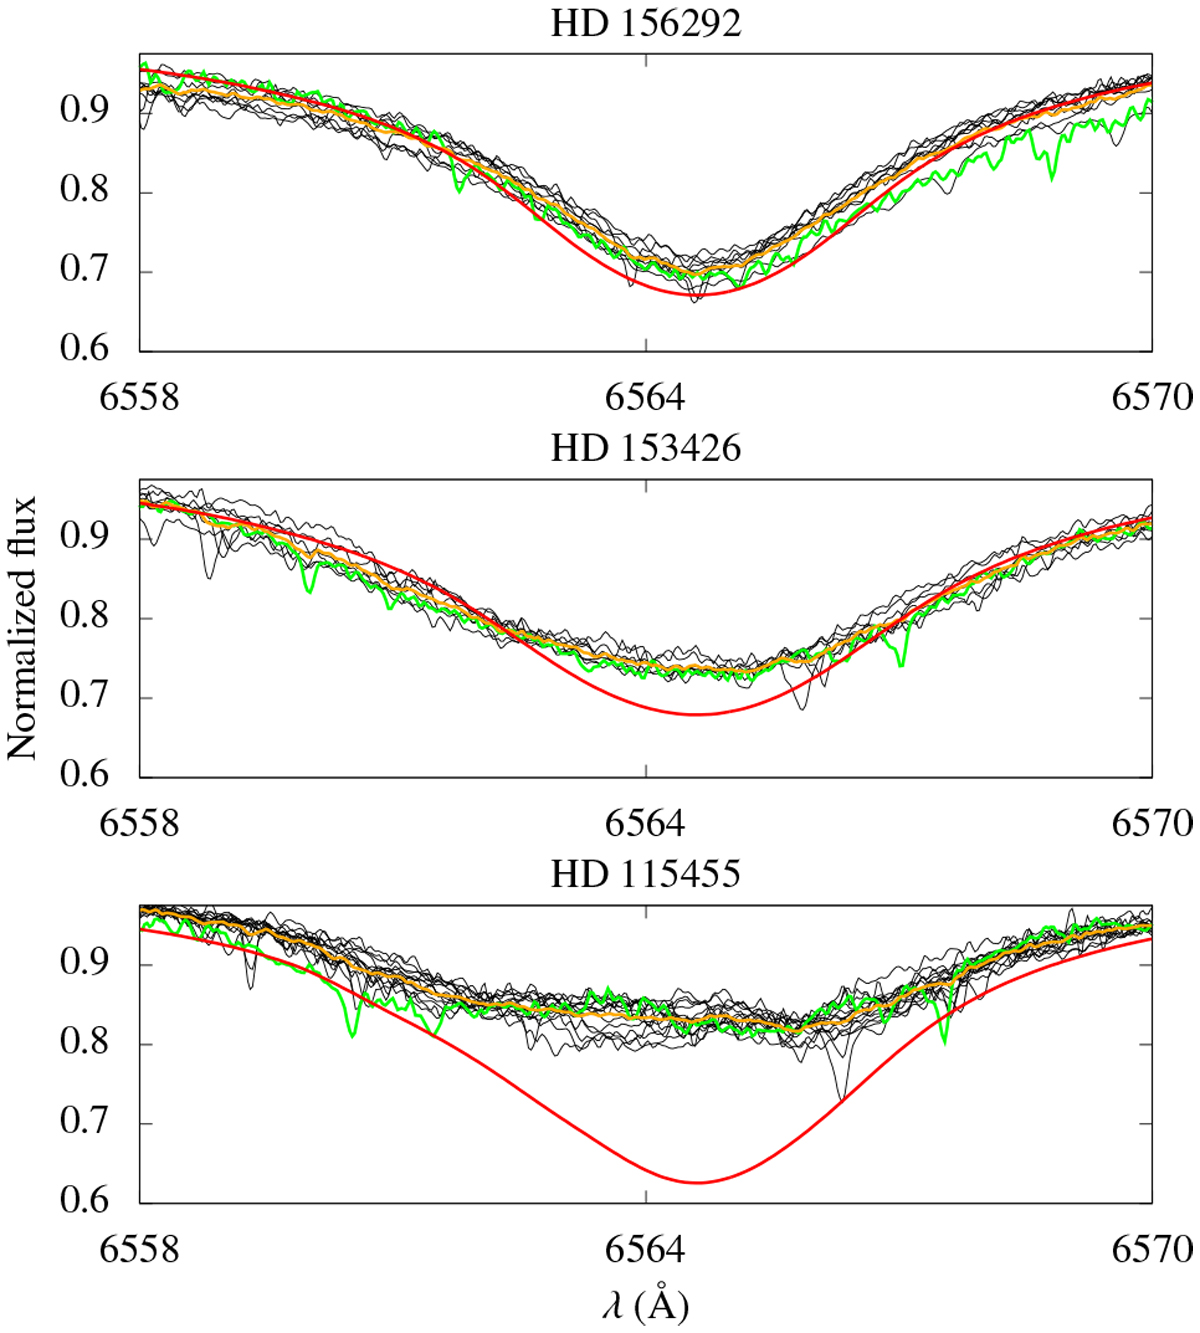
Effect of binarity on the Hα profile of the SB2 systems in our sample: HD 156292, HD 153426, and HD 115455. Archival FEROS data are shown in black. Our observed spectrum for each star is shown in green. Best-fit CMFGENmodel derived from the UV is shown in red. The observed spectra are shifted in λ to match the line core of the model. The mean spectra among all the observations is shown in orange. The observed spectra are on average more intense from HD 156292 towards HD 115455.
Current usage metrics show cumulative count of Article Views (full-text article views including HTML views, PDF and ePub downloads, according to the available data) and Abstracts Views on Vision4Press platform.
Data correspond to usage on the plateform after 2015. The current usage metrics is available 48-96 hours after online publication and is updated daily on week days.
Initial download of the metrics may take a while.